
Figure 2. Photomotor Responses in 7 dpf Zebrafish Larvae.
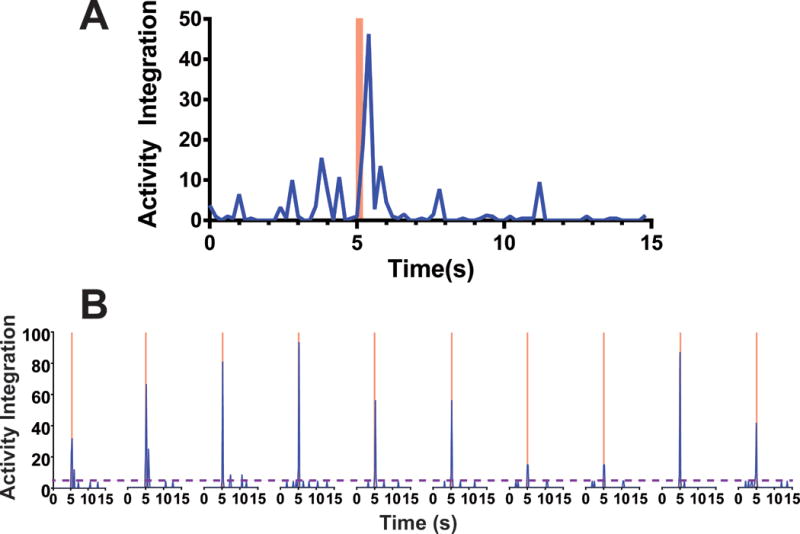
Activity integration is a Zebralab experimental output totaling the number and intensity of pixel changes in a designated image area between sequential infrared video sweeps during a 0.2 s experimental epoch (each epoch includes 5 video sweeps lasting 0.04 s). A) Average activity integration for 8 larvae in E3 buffer with 0.2% DMSO (control conditions) is plotted at 0.2 s intervals during a single photomotor response trial. A 500 lux white light stimulus was activated at 5 s and discontinued at 5.2 s (pink bar). Note that activity dramatically increased during the photic stimulus and diminished within 1 s. B) Activity of a single larva during a series of 10 photomotor response trials, with 3 minute intervals between trials, is shown. Pink bars indicate photic stimuli. The purple dashed line indicates the upper 95% confidence interval for mean baseline activity during all ten pre-stimulus epochs (5 s each). Activity during and following photic stimuli was consistently above the 95% baseline threshold in all trials, while varying in magnitude from trial to trial.