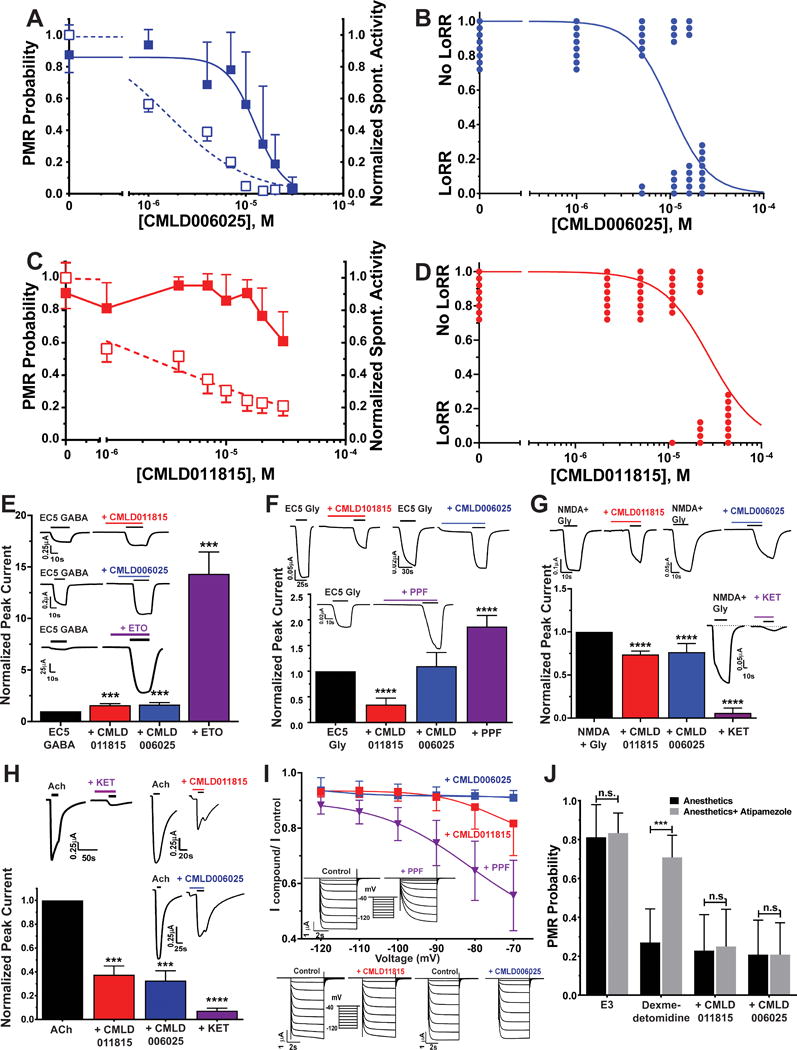
Figure 8. Characterization of CMLD006025 and CMLD011815 in Zebrafish Larvae, Xenopus Tadpoles, and Molecular Targets.

A) CMLD006025 inhibition of zebrafish larvae photomotor response (PMR) and spontaneous activity. Points represent mean with symmetric 95% CI (n = 12 per group) and lines are logistic fits. PMR inhibition (solid squares): EC50 = 13 μM (95% CI = 9.9 to 16 μM). Spontaneous activity inhibition (open squares): EC50 = 1.6 μM (95% CI = 1.2 to 2.1 μM). B) Tadpole LoRR results in the presence of CML006025 (n = 8 per group), shown as binary outcomes. The line is a logistic fit with EC50 = 10.1 μM (95% CI = 7.2 to 14.1 μM). C) CMLD011815 weakly inhibits larval zebrafish PMRs at concentrations above 10 μM (solid squares; mean with 95% CI; n = 16 per group). A logistic fit to PMR data did not converge. CMLD011815 inhibition of normalized spontaneous activity is plotted as open squares (mean with 95% CI) with logistic fit EC50 = 2.3 μM (95% CI = 1.4 to 3.9 μM). D) Tadpole LoRR results in the presence of CML011815 (n = 8 per group), shown as binary outcomes. The logistic fit EC50 is 28 μM (95% CI = 18 to 49 μM). E to H) Bars represent control-normalized ion channel currents (mean with symmetric 95% CI) measured in Xenopus oocytes. Currents in the presence of drugs at ≈ 2 × hypnotic EC50 were normalized to paired control currents in the same oocyte, and outcomes with drugs were compared to controls using one way ANOVA. Panel insets show examples of paired control vs. drug oocyte currents. E) Bars represent control-normalized EC5 GABA-induced currents through human α1β3γ2L GABAA receptors. CMLD011815 and CMLD006025 (both at 26 μM) similarly enhanced currents elicited with EC5 GABA (3 μM) by about 60% (p < 0.001 vs. control; n = 5, for both drugs). An equi-hypnotic etomidate solution (ETO; 3.2 μM) enhanced EC5 currents about 14-fold (p < 0.0001; n = 5). F) Bars represent control-normalized currents through human glycine α1 receptors. CMLD011815 (26 μM) inhibited currents elicited with EC5 glycine (1 μM) by about 65% (p < 0.0001; n = 4). In contrast, CMLD006025 (26 μM) did not significantly alter current amplitude (p = 0.29; n = 4). An equi-hypnotic propofol solution (PPF; 4.5 μM) enhanced EC5 currents about 1.8-fold (p < 0.0001; n = 4). G) Bars represent control-normalized currents through human NR1A/2B NMDA receptors. CMLD011815 and CMLD006025 (both at 26 μM) similarly inhibited currents elicited with 100 μM NMDA + 10 μM glycine by about 25% (p < 0.0001; n = 4 for both drugs). An equi-hypnotic ketamine solution (KET; 120 μM) inhibited currents about 95% (p < 0.0001; n = 4). H) Bars represent control-normalized currents through human α4β2 neuronal nicotinic ACh receptors. CMLD011815 and CMLD006025 (both at 26 μM) similarly inhibited currents elicited with1 mM ACh by about 65% (p = 0.0001; n = 4 for both drugs). An equi-hypnotic ketamine solution (KET; 120 μM) inhibited currents over 90% (p < 0.0001; n = 4). I) Symbols represent control-normalized peak currents (mean with 95% CI) through human HCN1 receptors. Currents were inhibited less than 10% in the presence of 26 μM CMLD006025 (n = 9), while an equal concentration of CMLD011815 (n = 9) inhibited currents by about 18% with activation at −70 mV. An equi-hypnotic solution of propofol (PPF; 4.5 μM; n = 5) inhibited HCN1 currents by over 40%. Boltzmann nonlinear regression of G/V relationships (not shown) indicate V50 shifts with both propofol (P< 0.0001 by F-test; n = 5) and with CMLD011815 (P = 0.0015 by F-test), but not with CMLD006025 (both P = 0.11 by F-test). J) Bars represent zebrafish larvae PMR responses (mean with 95%CI; n = 12 per group) measured in the absence and presence of atipamezole (10 nM). Atipamezole reverses PMR inhibition by dexmedetomidine (1.0 μM; p = 0.0001 by unpaired Student’s t-test), but not by equi-hypnotic concentrations of CMLD011815 (70 μM; p = 0.86) or CMLD006025 (33 μM; P > 0.999).
ETO = etomidate; PPF = propofol; KET = ketamine; *** P< 0.001; ****P< 0.0001.
