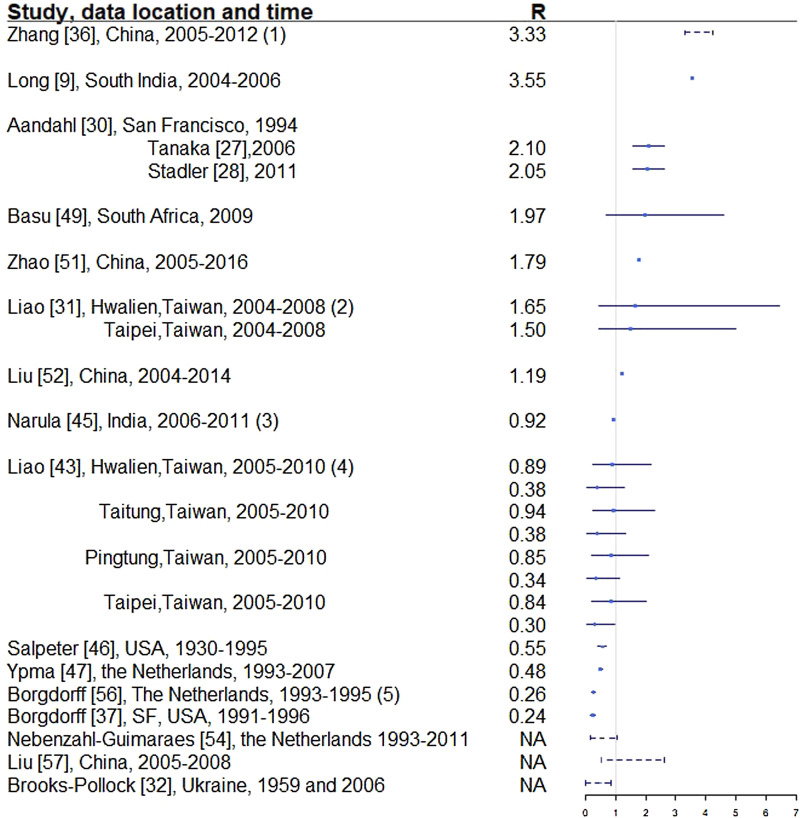
Fig. 4.
Reproductive number from studies with explicit R estimate from empirical data. Notes: (1) The range is for years 2005-2012, with the reproductive number estimated at 3.33, 3.72, 3.38, 3.97, 4.29, 3.32, 3.92 and 4.30, respectively. (2) For each location, the first R corresponds to drug-sensitive population and the second correspond to drug-resistant population. (3) R estimated for 35 states and union territories of India with estimates ranging from 0.72 to 0.98; 0.92 is the overall estimate for India. (4) For each location, the first R corresponds to drug-sensitive population and the second correspond to drug-resistant population. (5) Bordgorff in [27–29] estimated the reproductive number for the Netherlands from 1993 to 2007 at around 0.26 with lower bound of the 95% CI around 0.20 and upper bound around 0.32. (6) Broken lines indicate range; solid lines indicate 95% confidence interval. (7) Vynnycky and Fine [23] in 1998 estimated the basic reproductive number to decline from about 3 in 1900 to 2 in 1950 and to below 1 in about 1960 for England and Wales, which is not included in this graph.

