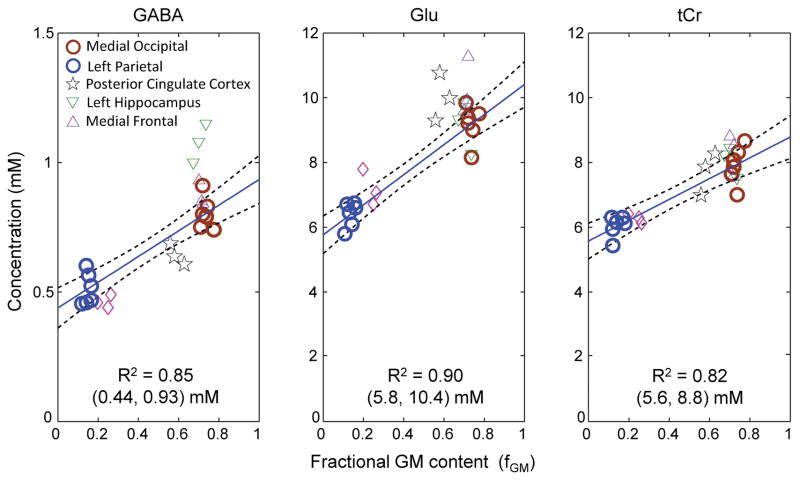
Figure 5.
Linear regression of the GABA, Glu and tCr estimates vs. fractional GM contents fGM (= GM/(GM+WM)). The regression was performed on the medial occipital and left parietal brain data (thick circles in blue and brown). For each metabolite, the Y-axis intercepts at fGM = 0 and 1 are shown in a bracket, below the coefficient of determination (R2). Dashed lines indicate 95% confidence intervals of the linear fits.

