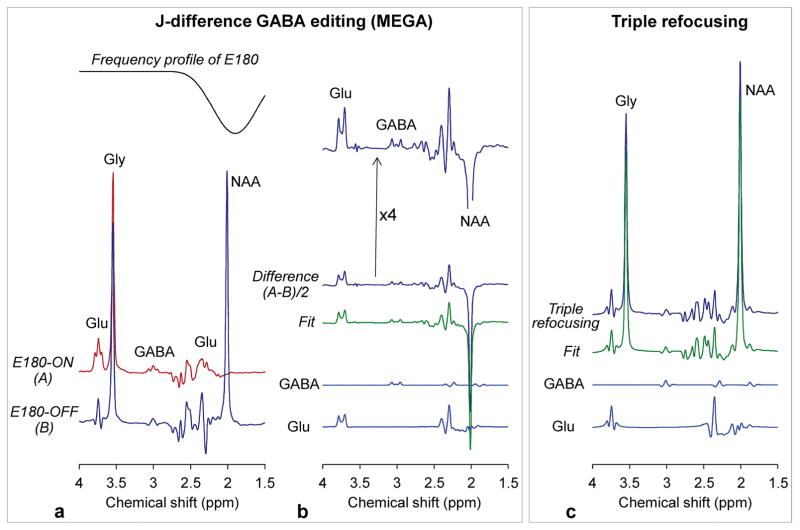
Figure 6.
In-vitro comparison of MEGA and triple refocusing in an aqueous solution with GABA (3 mM), Glu (30 mM), NAA (30 mM) and Gly (36 mM). (a) Shown below the inversion profile of the editing 180° RF pulse (E180) (13 ms Gaussian pulse truncated at 10%; Bandwidth 88 Hz) are MEGA E180-ON and E180-OFF subspectra. (b) A difference spectrum is shown together with an LCModel fit and the signals of GABA and Glu. A fourfold-magnified difference spectrum is shown at the top. (c) A triple-refocused spectrum is shown together with an LCModel fit and the GABA and Glu signals. For both MEGA and triple refocusing, spectra are scaled equal (except the magnified spectrum). Spectra were broadened to Gly singlet FWHM of 4 Hz.

