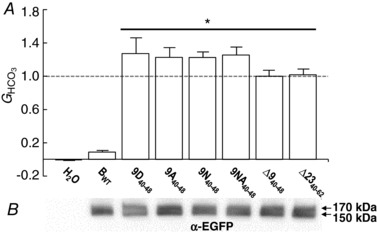
Figure 2. Summary of data from experiments that explore the cationic cluster.

A, HCO3 −‐dependent conductances (G HCO3) computed between −20 and +20 mV of I−V relationships. G HCO3 values were normalized to the G HCO3 (dashed line) from an oocyte – studied the same day – expressing ∆940–48. The n for each group (i.e. construct) is 6. The asterisk over the straight bar indicates the six groups significantly different, by one‐way ANOVA followed by post hoc Tukey's comparison, from H2O or BWT oocytes. B, surface‐biotinylated proteins, analysed by western blotting. The 8 contiguous lanes (the H2O is virtually blank) of the blot are aligned with the labels in A.
