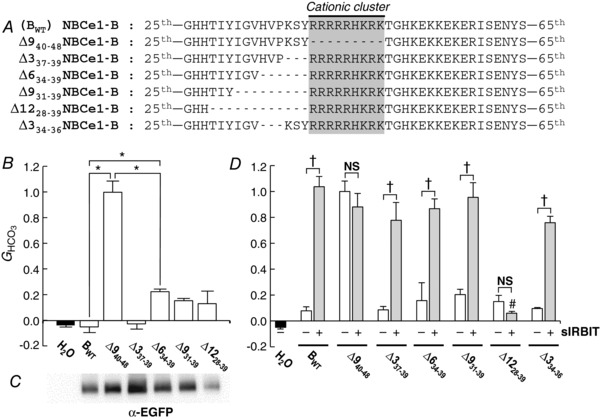
Figure 3. Construct designs and data summary from experiments that explore regions upstream of the cationic cluster.

A, designs of constructs. In addition to Δ940–48 (see Fig. 1A), we created 5 additional deletion constructs, based on NBCe1‐B (BWT). B, HCO3 −‐dependent conductances (G HCO3) computed between −20 and +20 mV of I−V relationships. G HCO3 values were normalized to the G HCO3 from an oocyte – studied the same day – expressing ∆940–48. The n for each group (i.e. construct) is 6. Asterisks indicate significant differences, by one‐way ANOVA followed by post hoc Tukey's comparison. C, surface‐biotinylated proteins, analysed by western blotting. The 7 contiguous lanes (the H2O is virtually blank) of the blot are aligned with the labels in B. This blot is representative of two trials, which confirm that ∆1228–39 is present at relatively low abundance in the plasma membrane. D, HCO3 −‐dependent conductances (G HCO3) from oocytes expressing seven different constructs, without or with super‐IRBIT (sIRBIT). G HCO3 values were normalized to the G HCO3 from an oocyte – studied the same day – expressing ∆940–48 without sIRBIT. The n for each group is 3–6. †Pairs are significantly different in a one‐tailed, unpaired t test. NS, not significant. #Grey bar is significantly different from the other grey bars in an ANOVA with Tukey's post hoc comparison.
