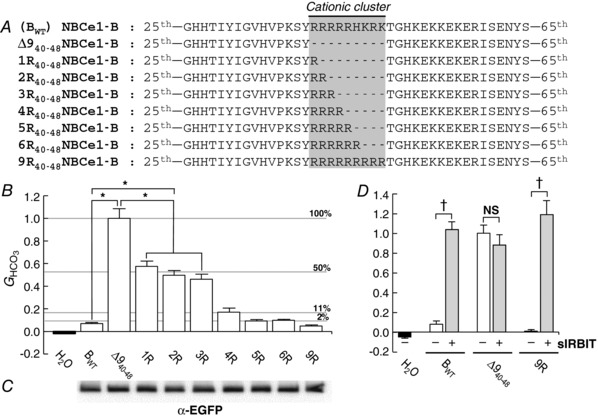
Figure 5. Construct designs and data summary from experiments for varying numbers of positively charged residues in the cationic cluster.

A, designs of constructs. In addition to Δ940–48 (see Fig. 1A), we created 7 additional constructs, based on NBCe1‐B (BWT). B, HCO3 −‐dependent conductances (G HCO3) computed between −20 and +20 mV of I−V relationships. G HCO3 values were normalized to the G HCO3 from an oocyte – studied the same day – expressing ∆940–48. The n for each group (i.e. construct) is 6. Asterisks indicate significant differences, by one‐way ANOVA followed by post hoc Tukey's comparison. Although not indicated by asterisks for the sake of clarity, 4R, 5R, 6R and 9R – although not different from one another – are all significantly different from Δ940–48, 1R, 2R and 3R. Labelled horizontal lines indicate percentage autoinhibition. C, surface‐biotinylated proteins, analysed by western blotting. The 9 contiguous lanes (the H2O sample was omitted due to the limited number of loading wells) of the blot are aligned with the labels in B. Biotinylated proteins were analysed by western blotting. D, HCO3 −‐dependent conductances (G HCO3) from oocytes expressing three different constructs, without or with super‐IRBIT (sIRBIT). G HCO3 values were normalized to the G HCO3 from an oocyte – studied the same day – expressing ∆940–48 without sIRBIT. The n for each group is 3–6. †Pairs are significantly different in a one‐tailed, unpaired t test. NS, not significant.
