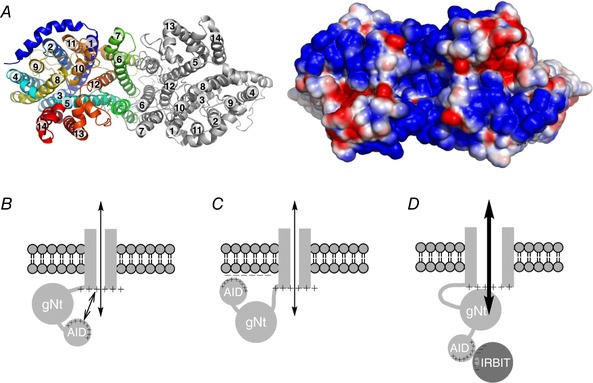
Figure 8. Proposed models.

A, model of NBCe1 dimeric transmembrane domain, viewed from the cytosolic side. Left panel shows the modelled structure created by I‐TASSER. Each transmembrane helix is identified by a number. Right panel shows an electrostatic potential map, corresponding to the structure on the left. This map is limited to the solvent‐accessible surface. The thresholds for red (−) or blue (+) were set at ±0.6 kcal/(mole × e 0), where e 0 is the elementary charge. B, one possible mechanism of autoinhibition. Here, repulsion between (a) positive charges in the cationic cluster of the AID and (b) dominant positive charges from the cytosolic surface prevents the interaction between (c) the globular/structured portion of the Nt (gNt) and (d) the TMD, and thereby produces autoinhibition. C, another possible mechanism of autoinhibition. Here, attraction between (a) positive charges in the cationic cluster and (b) negative charges on the leaflet of the plasma membrane prevents the interaction between the gNt and the TMD. D, possible mechanism of relief of autoinhibition by IRBIT. Here, negative charges on IRBIT mask the positive charges in the cationic cluster, and thus allow the gNt to interact with – and thereby stimulate – the TMD.
