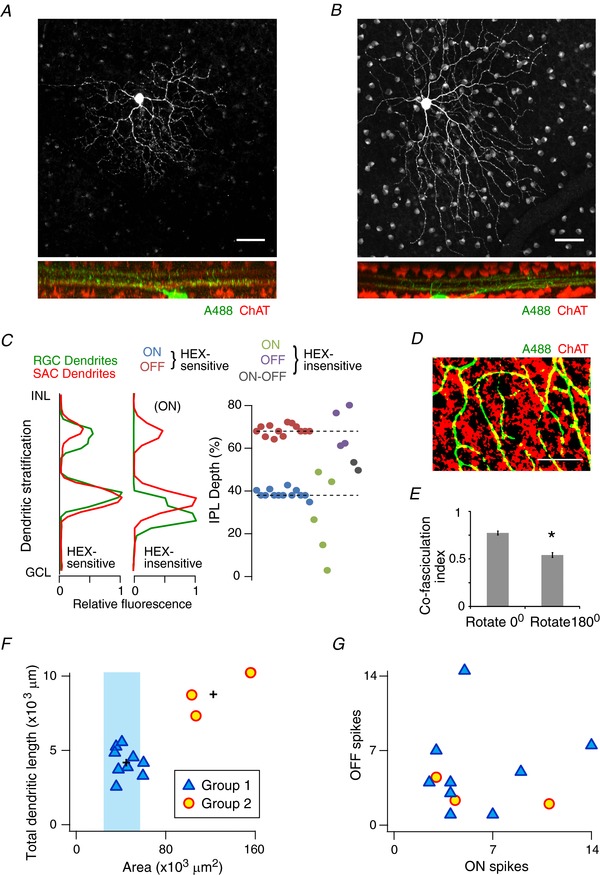
Figure 2. Rat HEX‐sensitive neurons co‐stratify with starburst amacrine cells.

A and B, dendritic stratification of Alexa 488‐stained cells that co‐stratify with starburst dendrites labelled with ChAT antibodies (bottom panel). Scale bar = 50 μm. C, relative fluorescence of starburst dendrites along the depth of the IPL compared to the dendrites of a HEX‐sensitive cell (left) and a HEX‐insensitive neuron (middle). The right panel shows the stratification index (see methods) of 13 HEX‐sensitive cells and 11 HEX‐insensitive cells. The dashed line indicates the average ON (38 ± 1%) and OFF (68 ± 1%) ChAT bands (n = 24). The ON and OFF arbors were not clear for the two ON‐OFF HEX‐insensitive cells and hence are represented by a single value. D, the co‐fasciculation of a HEX‐sensitive neuron's dendrites with the starburst dendrites (scale bar = 50 μm). E, summary of the average co‐fasciculation index for all HEX‐sensitive cells compared to when the index was calculated after rotating the HEX‐sensitive cell's dendrites by 180° (see methods; 0° = 0.77 ± 0.02; 180° = 0.54 ± 0.03; * P < 0.001). F, a plot of the total dendritic length compared to dendritic area in HEX‐sensitive cells. Cluster analysis indicated two groups of HEX‐sensitive cells (n = 12). The (+) symbols indicate the centres of the two groups. The light shaded region shows the dendritic area of DSGC‐like cells observed by Sun et al. (2002). Hence Group 1 cells are likely to be DSGCs. We were unable to reconstruct the complete dendritic tree for one HEX‐sensitive cell, which was excluded from this analysis. G, comparison of the total number of OFF spikes vs. ON spikes evoked by light shown in Fig. 1. The two groups could not be differentiated based on this property.
