
Figure 3. Cholinergic contribution to synaptic responses.
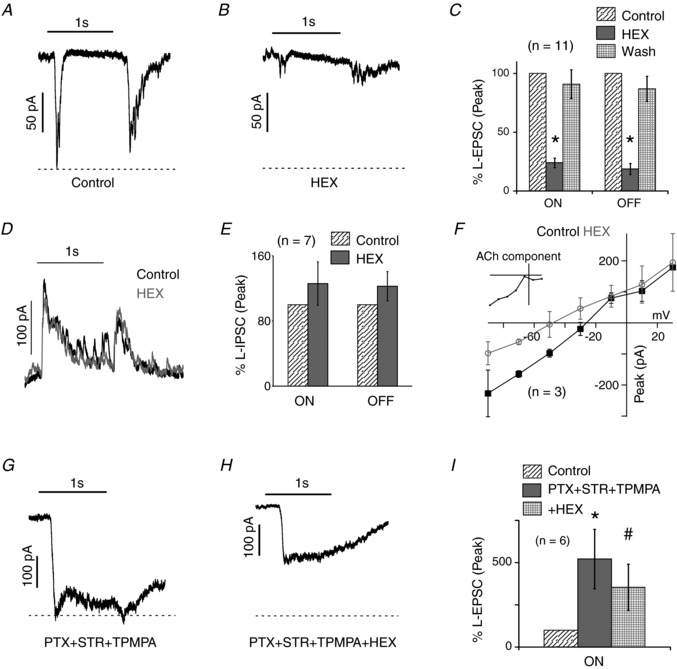
A and B, light evoked excitatory postsynaptic currents (L‐EPSC) of a rat HEX‐sensitive neuron in control and in 100 μM HEX. The light stimulus was a 200 μm diameter green spot with an intensity of 2.4 × 10⁴ R*/rod/s. C, mean relative peak of ON and OFF L‐EPSCs in HEX relative to control and wash (n = 11; * P < 0.001). D, the light‐evoked inhibitory postsynaptic currents (L‐IPSCs) of a HEX‐sensitive neuron in control and in HEX. E, mean relative peak of ON and OFF L‐IPSCs in HEX relative to control (n = 7; ON: P = 0.37; OFF: P = 0.26). F, mean peak amplitude of postsynaptic currents in HEX‐sensitive neurons held at seven different voltages (−90 mV to +30 mV), in control and HEX (n = 3). The inset shows the ACh component estimated as the difference of currents in control and HEX. G and H, the L‐EPSCs of the cell shown in A in PTX + STR + TPMPA, then plus HEX. PTX + STR + TPMPA dramatically increased the L‐EPSCs; note the change in scale. I, peak ON L‐EPSCs in PTX + STR + TPMPA and then plus HEX relative to control (n = 6; * P < 0.005, # P < 0.05).