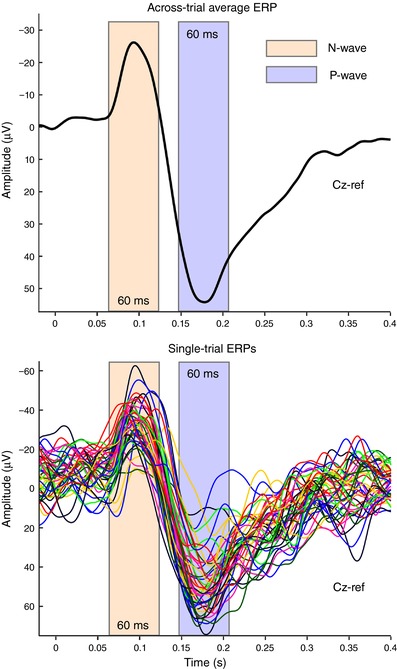
Figure 2. Estimation of single‐trial amplitude of the N and P vertex waves.

After calculating the across‐trial average ERP at Cz in each participant (top), a 60‐ms time window centred around each peak was defined (N wave, orange; P wave, blue), and the maximum negative value (for the N wave interval) and positive value (for the P wave interval) were extracted. Data from a representative participant of Experiment 1. [Color figure can be viewed at http://wileyonlinelibrary.com]
