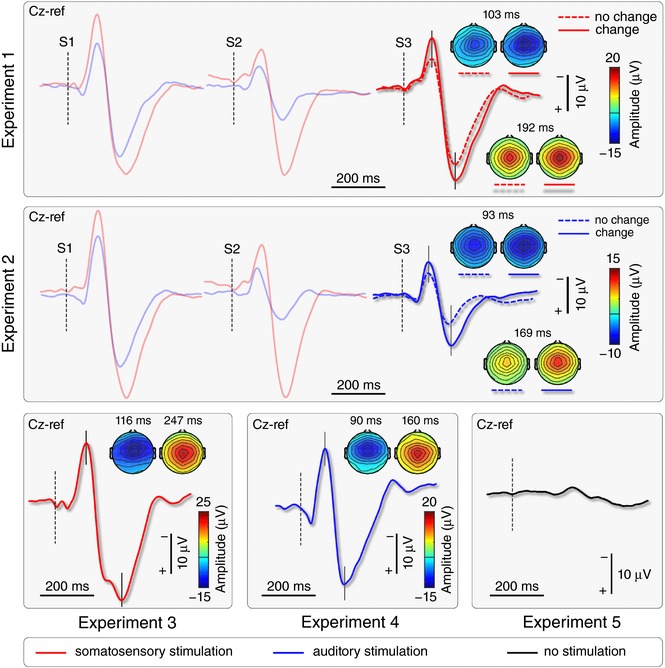
Figure 3. ERP waveforms and topographies.

Thick waveforms show the group‐level average VW elicited by either somatosensory (red) or auditory (blue) stimuli presented simultaneously to the ‘go’ cue of the visuomotor task. Vertical dashed lines mark stimulus onset. Scalp topographies at the peak of the N and P waves show the typical distribution maximal at the vertex. In Experiments 1 and 2, the amplitude of S3‐ERPs elicited by physically‐identical stimuli was larger when there was a change of modality between S2 and S3. Note also the lack of a VW in Experiment 5, in which no somatosensory or auditory stimuli were delivered. [Color figure can be viewed at http://wileyonlinelibrary.com]
