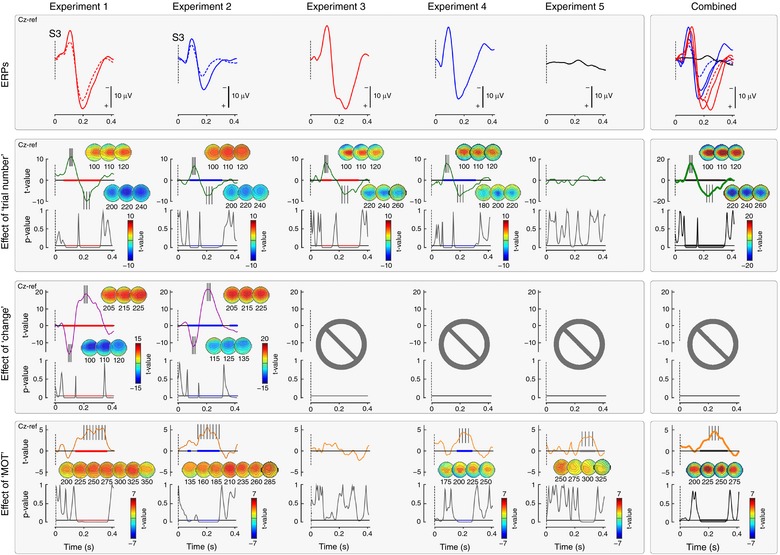
Figure 5. Results of the LME analysis.

Top row: group‐level average EEG waveforms for each experiment. Bottom rows: relationship between EEG signal at Cz and factors ‘change’ (Experiments 1 and 2), and ‘MOT’ (all experiments), after controlling for an effect of ‘trial number’ (all experiments) (i.e. when such an effect was found, it was regressed out). The strength of the relationship is expressed as t values, and its significance as P values. Scalpmaps show the topographical distribution of t values at the significant time intervals (highlighted in colours, after correction using permutation testing). In Experiments 1–4, in which stimuli evoking an ERP were delivered, there was strong evidence of a significant effect of trial number on EEG amplitude. This indicates that, in all experiments, N and P amplitude was reduced as trial number increased. In Experiments 1 and 2, which entailed a change of stimulus modality, there was strong evidence that the modality change resulted in a bigger amplitude of both the N and P waves of the S3‐ERP. In all experiments except Experiment 3, there was strong evidence that a more negative EEG amplitude within a time window approximately corresponding to P wave time window predicted shorter MOT of the subsequent movement. Crucially, Experiment 5 showed that this relationship was still present (fifth graph of the bottom row) even without an evoked response. The right column shows the results from all of the experiments combined. [Color figure can be viewed at http://wileyonlinelibrary.com]
