
Figure 3. The substrates of motor behaviours are distributed between brain and spinal cord.
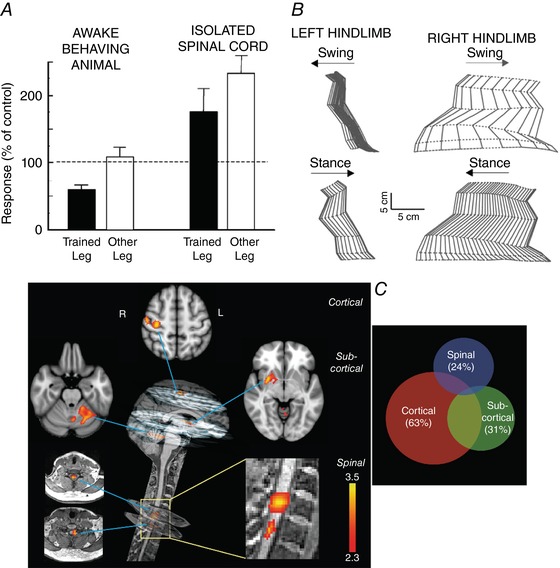
A, reflex responses from monkeys after H‐reflex down‐conditioning. Left side: average triceps surae H‐reflexes of awake behaving monkeys in the down‐conditioned (i.e. trained) leg and the other leg. The H‐reflex in the trained leg is much smaller than its control value, while the H‐reflex in the other leg is not changed from control. Right side: average maximum triceps surae monosynaptic reflex responses to dorsal root stimulation from the same monkeys under anaesthesia and after mid‐thoracic spinal cord transaction. The reflex asymmetry created by down‐conditioning is still present, but the reflexes in both legs are larger than those from the isolated spinal cords of control (i.e. unconditioned) monkeys. The contrast between the results from the awake behaving animals and the results from their isolated spinal cords indicates that the H‐reflex down‐conditioning protocol produced plasticity in the brain and on both sides of the spinal cord. Data from Wolpaw and Lee (1987, 1989) and Wolpaw et al. (1993). B, joint angles of the left and right hindlimbs during the swing and stance phases of clonidine‐induced locomotion 72 days after spinalization in a cat in which the left lateral gastrocnemius and soleus (LGS) muscles had been denervated 49 days before spinalization. During the 49 days prior to spinalization, locomotion had recovered from the impairment produced by the denervation. To prevent overlap, individual stick figures are displaced by an amount equal to the displacement of the foot along the horizontal axis. Left and right hindlimbs are viewed from the left and right sides, respectively. Horizontal arrows indicate the direction of hindlimb movement during the stance and swing phases. Spinal locomotion is greatly impaired on the left side (i.e. the denervated side), indicating that the spinal cord had changed during the pre‐spinalization compensation following the left LGS denervation. From Frigon and Rossignol (2009), Elsevier, with permission. C, neural correlates of motor sequence learning (i.e. a specific sequence of individual finger flexions). Left: distinct cortical, subcortical and spinal clusters show learning‐related modulation in activity during the motor sequence learning condition. All activation clusters correlate positively with performance speed. The cortical activation cluster is in the contralateral sensorimotor cortex. At the subcortical level, one cluster is in the contralateral putamen, while the other is in lobule V–VI of the ipsilateral cerebellum. The spinal cord activation clusters are centred in the C7 and C8 spinal segments. (The colour bars indicate Z‐score values; all activation maps are corrected for multiple comparisons.) Right: activity in both the spinal cord and the brain accounts for non‐overlapping portions of the variability in performance speed. The Venn diagram illustrates the amount of performance variability that is explained by cortical, subcortical or spinal cord activity independently, as well as their shared variance. The numbers in parentheses are the percentage of total variance explained by the activity in each region. Brain and spinal cord plasticity make independent contributions to performance. From Vahdat et al. (2015).