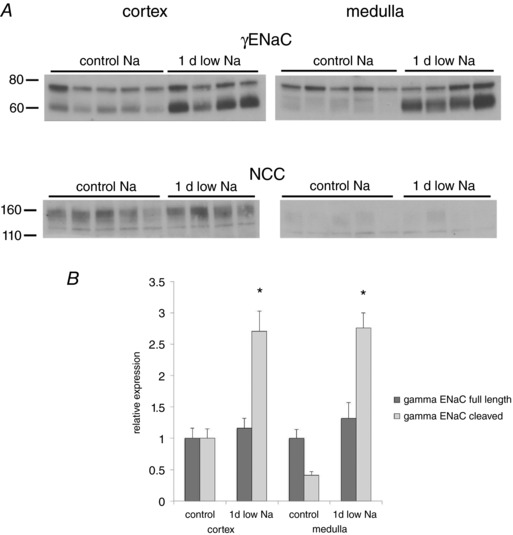
Figure 5. Comparison of the effects of low‐Na diet on γENaC and NCC protein from renal cortex and medulla.

A, changes in γENaC and NCC after 1 day of a low‐Na diet in tissue from the outer cortex and from the medulla. NCC protein was abundant in the cortex but not in the medulla, consistent with expression mainly in the DCT. B, quantitative analysis of γENaC expression. Significant increases in the cleaved form of the subunit occurred in both cortex and medulla. Data represent the mean ± SEM for four low‐Na and five control rats. *Statistical difference of the indicated low‐Na group relative to controls [P = 0.003 (cortex), P = 0.0001 (medulla)].
