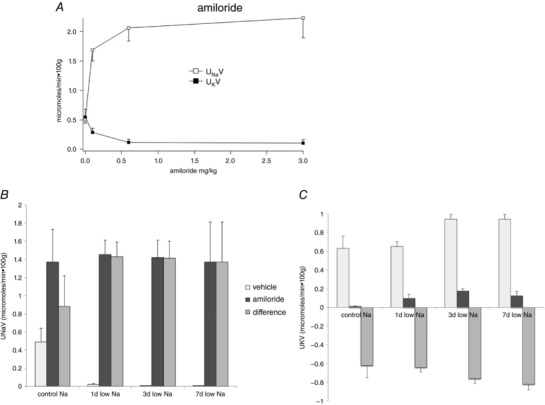
Figure 9. Effects of amiloride on Na+ and K+ excretion in animals on control and low‐Na diets.

A, dose–response relationships for changes in U Na V and U K V in response to a single injection of amiloride in rats on normal laboratory chow. B and C, effects of amiloride (1 mg kg–1) on U Na V (B) and U K V (C) in animals on control diet and on a low‐Na diet for 1, 3 or 7 days. Data represent the mean ± SEM for four to 12 animals.
