
Figure 3. Autophagy flux in young and aged muscle with CCA.
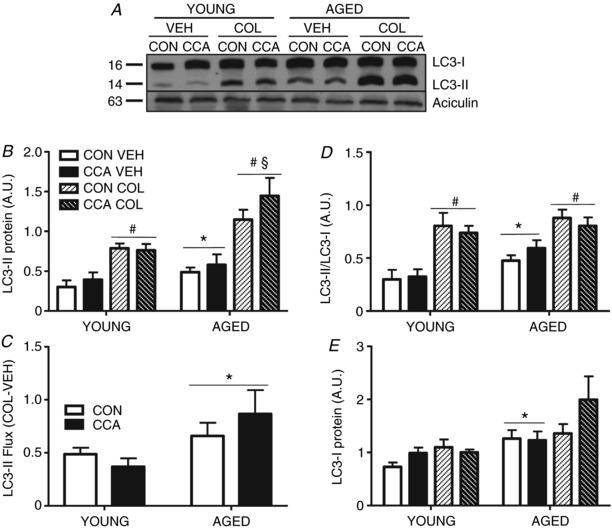
LC3‐II protein expression was measured in whole muscle samples to determine autophagic flux (n = 7) A–C, flux was calculated by subtracting VEH LC3‐II ratios from COL LC3‐II ratios (COL‐VEH; ratios were normalized to aciculin), for CON and CCA conditions in young and aged groups (n = 7). C, the LC3‐II/LC3‐I ratio was also assessed to compare and contrast against previous publications (n = 6–7). D, expression of the precursor LC3‐I was assessed under all experimental conditions (n = 6–7). E, representative blots are shown. Data are presented as means ± SEM. * P < 0.05, main effect of age; # P < 0.05, main effect of COL. § P < 0.05, aged COL vs. young COL, main effect. CON, control; CCA, chronic contractile activity; COL, colchicine; VEH, vehicle.