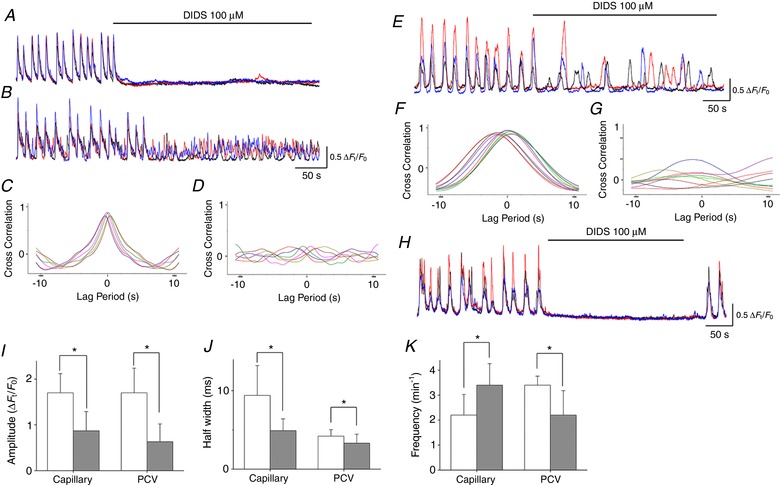
Figure 7. Role of CaCC in generating pericyte Ca2+ transients in different microvascular segments.

In a PCA, DIDS (100 μm) prevented the generation of synchronous spontaneous Ca2+ transients in three pericytes (A). Simultaneous recording from three pericytes in a connected capillary showed synchronous spontaneous Ca2+ transient but DIDS (100 μm) suppressed the Ca2+ transients and disrupted their synchrony (B). Cross‐correlation analysis demonstrated that the prominent peak near time zero in control (C) was largely suppressed by DIDS (D). In a PCV, DIDS (100 μm) disrupted the synchrony of spontaneous Ca2+ transients amongst three pericytes (E). Cross‐correlation analysis showed that the prominent peak near time zero in control (F) was largely suppressed by DIDS (G). In a venule, DIDS (100 μm) prevented the generation of synchronous spontaneous Ca2+ transients in three pericytes (H). Spontaneous Ca2+ transients were restored after washout of carbenoxolone. Amplitude (I), half‐width (J) and frequency (K) of spontaneous Ca2+ transients in pericytes of capillary and PCV are summarized. Data are the mean ± SD. *Significantly different from the control values (paired Student's t test, P < 0.05). [Color figure can be viewed at http://wileyonlinelibrary.com]
