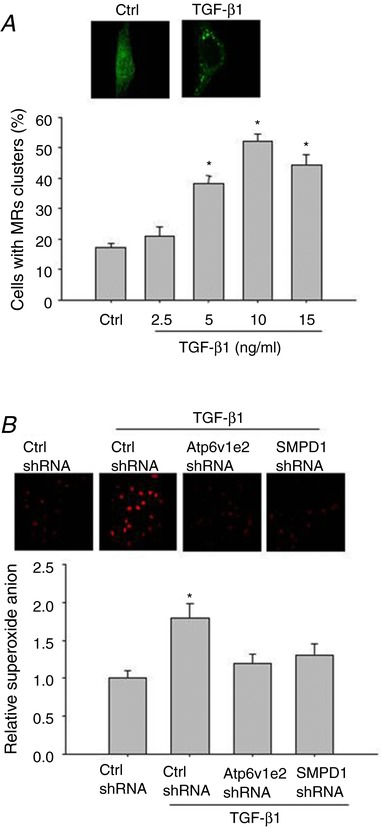
Figure 1. TGF‐β1 induced MRs formation and ROS production in renal tubular cells.

A, representative confocal fluorescence images (upper panel) and summarized data (lower panel) showing the effect of TGF‐β1 on MR formation. B, representative graphical representation (upper panel) and summarized data (lower panel) showing the effect of Atp6v1e2 shRNA and SMPD1 shRNA on TGF‐β1‐induced ROS production in DHE staining. Results are the means ± SEM of measurements from five separate preparations. * P < 0.05 vs. control group in A, * P < 0.05 vs. other groups in B. [Color figure can be viewed at http://wileyonlinelibrary.com]
