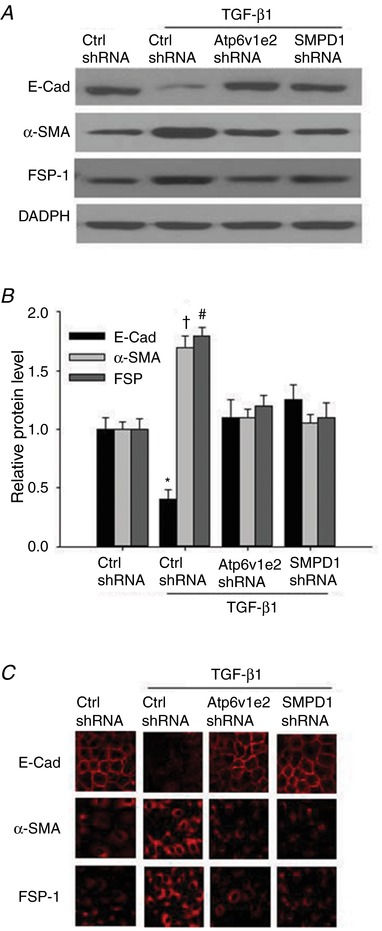
Figure 2. Atp6v1e2 shRNA and SMPD1 shRNA inhibit TGF‐β1‐induced changes in E‐cad, α‐SMA and FSP‐1 as found by western blot assay and immunofluorescence microscopy assay.

Representative western blot images (A) and summarized data (B) showing the inhibitory effect of Atp6v1e2 shRNA and SMPD1 shRNA on TGF‐β1‐induced decrease in the epithelial marker E‐cad, and increases in mesenchymal markers α‐SMA and FSP‐1. C, representative images showing the inhibitory effect of Atp6v1e2 shRNA and SMPD1 shRNA on TGF‐β1‐induced decreases in the epithelial marker E‐cadherin, and increases in mesenchymal markers α‐SMA and FSP‐1 by immunofluorescence microscopy assay. E‐Cad, E‐cadherin; α‐SMA, α‐smooth muscle actin; FSP‐1, fibroblast‐specific protein‐1. Results are the means ± SEM of measurements from five separate preparations. * P < 0.05, † P < 0.05 and # P < 0.05 vs. other groups for E‐cadherin, α‐SMA and FSP‐1, respectively. [Color figure can be viewed at http://wileyonlinelibrary.com]
