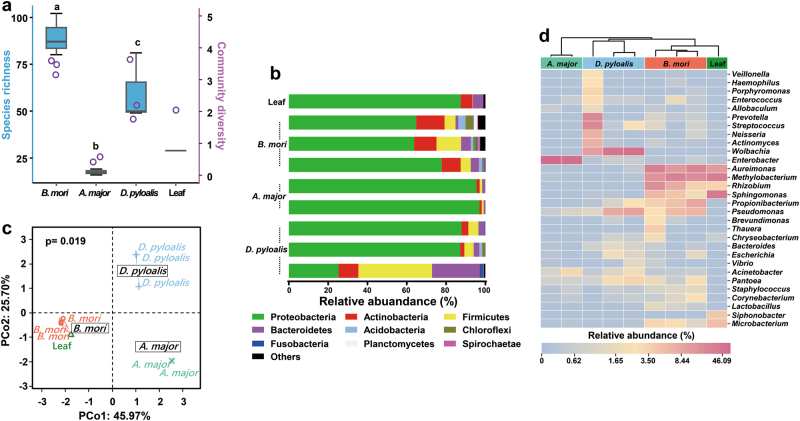
Fig. 1.
Gut bacterial community dynamics among mulberry-feeding lepidopterans. a Boxplot of species richness (number of OTUs) and community diversity measured by Shannon index. Letters above each host species indicate significant differences (one-way ANOVA, LSD post-hoc test, P < 0.05, see Supplementary Table S7) in the mean values. b Relative abundance of bacterial phyla in different samples. c PCoA plot based on community structure. Each symbol represents a sample, colored by host phylogeny. Variation in communities segregated strongly according to host phylogeny, with B. mori, A. major and D. pyloalis forming discrete groups (PERMANOVA test with 999 permutations, P ≤ 0.05, see Supplementary Table S8). d Heatmap showing the relative abundance of dominant taxa. Hierarchical cluster analysis was based on the Bray–Curtis distance with complete-linkage method. Each bar or column represents an individual insect

