Fig. 4.
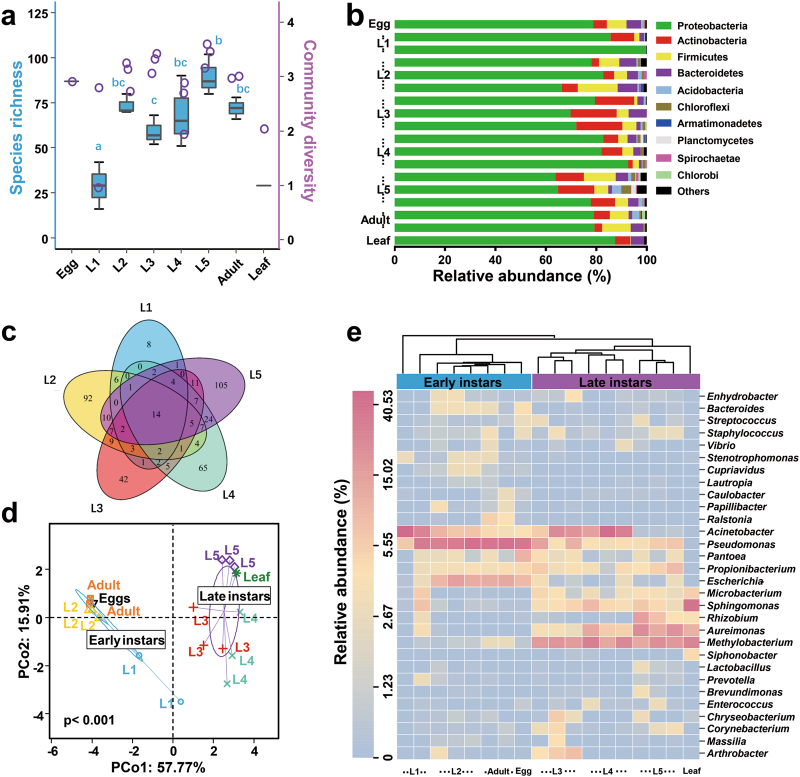
Gut bacteria dynamics across successive life stages of B. mori. a Boxplot of species richness and community diversity throughout development. Different letters indicate statistical significance (one-way ANOVA, LSD post-hoc test, P < 0.05, see Supplementary Table S10). b Phylum-level taxonomic succession. c Overlap of OTUs at the larval stage. d PCoA showing that gut microbiotas segregated strongly according to host developmental stage, with early instars and late instars forming discrete groups (PERMANOVA test with 999 permutations, P < 0.01, see Supplementary Table S8). e Heatmap of major taxa over the life cycle. Cluster analysis used the Bray–Curtis distance and complete-linkage method. Each point, bar or column represents a single individual

