Figure 2.
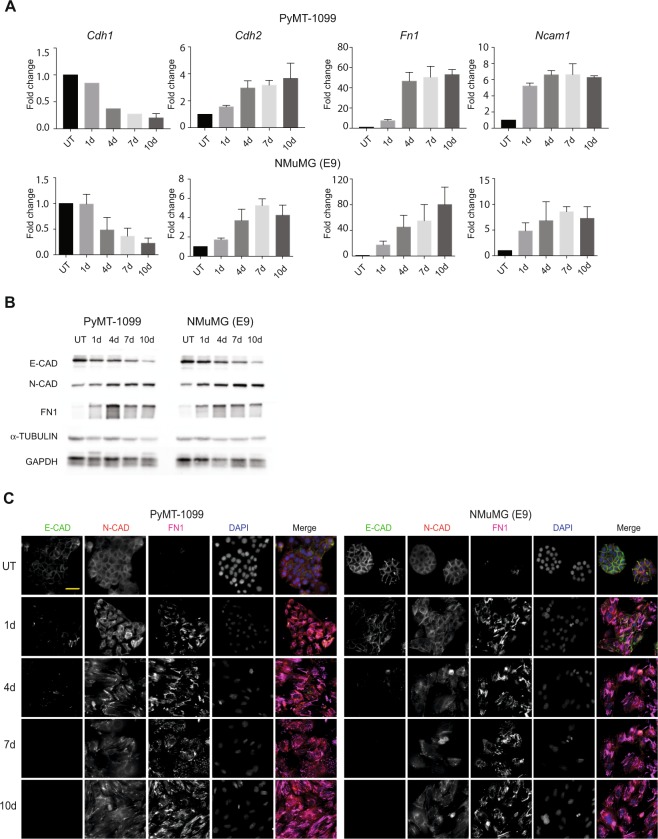
TGFβ-induced EMT in PyMT-1099 and NMuMG cells. PyMT-1099 (top of panel) and NMuMG (E9) (bottom of panel) cells were in parallel treated with TGFβ for 0 (UT), 1, 4, 7 or 10 days. (A) RNA isolated from the cells was subjected to quantitative RT-PCR analyses of EMT markers. Graphs represent the relative RNA expression levels of epithelial marker, Cdh1 and mesenchymal markers Cdh2, Fn1 and Ncam1 normalized the housekeeping gene Rpl19; n = 3. (B) Immunoblotting analyses was performed to assess the protein expression levels of epithelial marker E-CAD and mesenchymal markers N-CAD and FN1. α-TUBULIN was used as the loading control; n = 3. All samples were run in parallel on the same gel. Uncropped immunoblot scans from main blots are displayed in Fig. S5. (C) Immunofluorescence analysis was performed to assess the expression and/or localization of EMT markers E-CAD, N-CAD and FN1; n = 3. DAPI was used as a nuclear counterstain. Scale bar, 50 μm.

