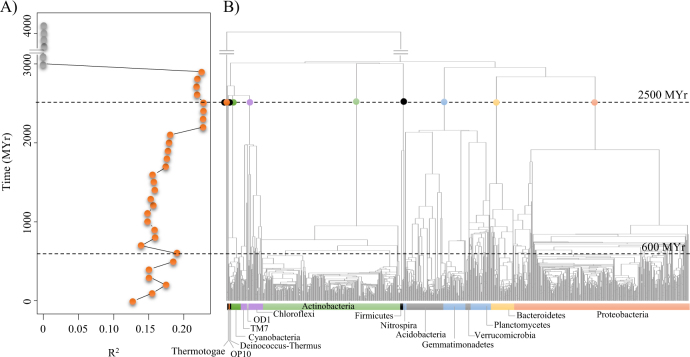
Fig. 4.
a Phylogenetic-scale disparities in the relationship between soil bacterial diversity and ecosystem functions (correlation between β-diversity and decomposition distance) at different temporal slices. Significant and nonsignificant correlations are indicated with orange and grey circles, respectively. The time points at which the highest correlations are obtained are shown with horizontal dashed lines and projected to the phylogenetic tree. b Bacterial phylogenetic tree depicting the evolutionary relationships between 16 phyla present in the study system. At 2500 Myr, coloured circles indicate eight extant phyla and the most recent common ancestors of the clades Chloroflexi-OD1-TM7 and Planctomycetes–Verrucomicrobia–Gemmatimonadetes–Acidobacteria–Nitrospira

