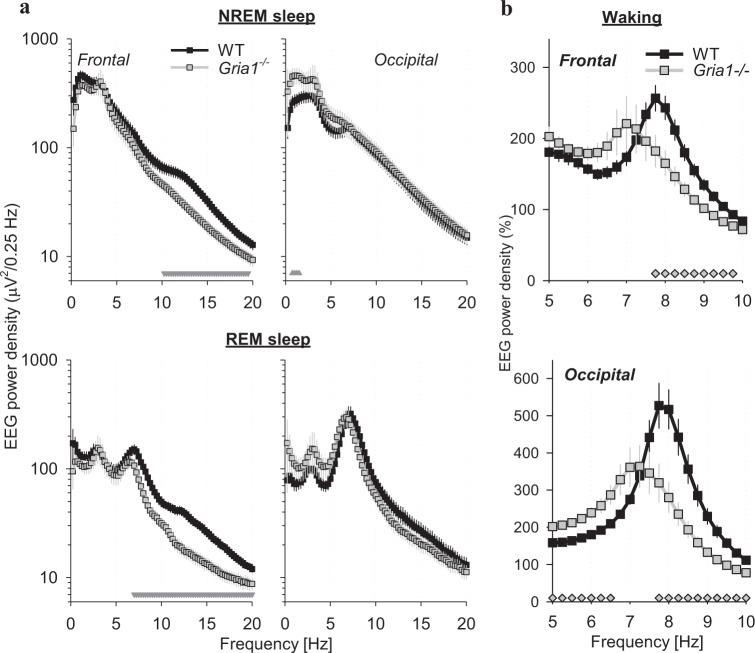
Fig. 2.
a EEG power density during NREM sleep (top) and REM sleep (bottom) in the frontal (left) and occipital (right) derivation. Mean values, SEM, n = 8 (WT) and n = 6 (Gria1-/-); NREM: genotype*derivation*bin interaction: F(80,960) = 4.582, p < 0.001; REM: genotype*derivation*bin interaction: F(80,960) = 3.612, p < 0.001; three-way repeated-measures ANOVA on log-transformed values; note that the data for the frontal and occipital derivation are shown in separate plots for clarity). The triangles below depict frequency bins where EEG spectra differed significantly between the genotypes (p < 0.05, post hoc Bonferroni test). b EEG power density during waking in the frontal (left) and occipital (right) derivation. Mean values, SEM (WT: n = 8, Gria1−/−: n = 6), are shown for the frequency range encompassing theta-activity, and the values are expressed as % of mean EEG power density across all frequencies from 0.5 to 20 Hz excluding the theta-frequency range (genotype*derivation*bin interaction: F(80,960) = 2.455, p < 0.001, three-way repeated-measures ANOVA on log-transformed values). The symbols below depict frequency bins where EEG spectra differed significantly between the genotypes (p < 0.05, Bonferroni post hoc test)

