Fig. 5.
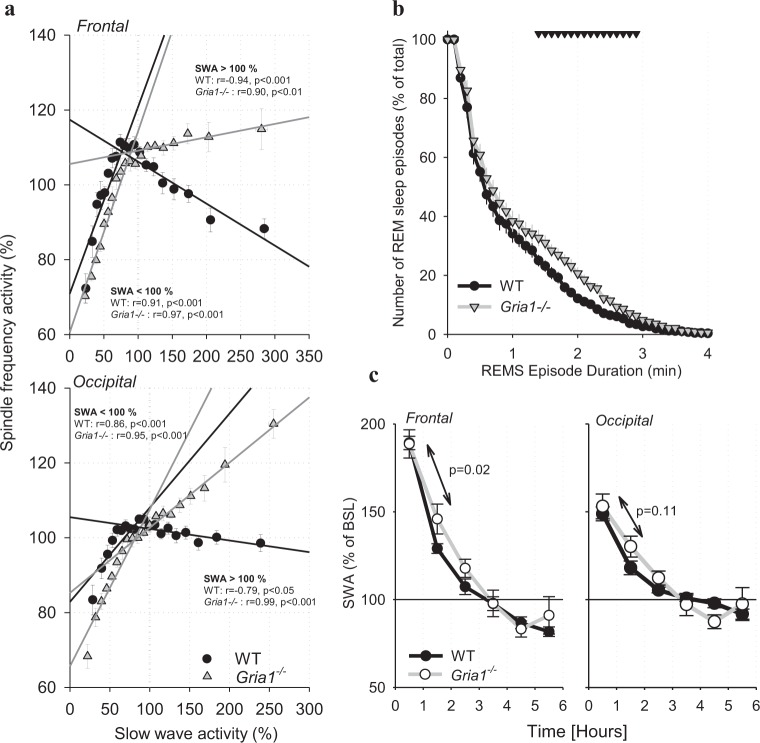
a The relationship between EEG slow-wave activity (SWA, 0.5–4.0 Hz) and EEG spindle-frequency activity (SFA, 10–15 Hz) during baseline. All 4-s epochs in artefact-free NREM sleep occurring during the 24-h baseline were subdivided into twenty 5% bins as a function of SWA sorted from lowest to highest values, and corresponding SFA values were averaged for the same epochs prior to calculating means between animals (shown as symbols, n = 8 for WT and n = 6 for Gria1−/−, SEM). Straight lines depict linear regressions separately for epochs with SWA < 100% ( = below the mean value of SWA over the 24-h period) and <100% ( = above the mean value of SWA over the 24-h period). R and p-values correspond to Pearson’s product moment correlation. Note that when SWA is low (<24-h mean), it correlates positively with SFA in both genotypes, but the correlation is negative for SWA values >100% for WT mice only. b Survival analysis of REM sleep continuity (genotype*bin interaction: F(50, 600) = 2.016, p < 0.001, two-way repeated-measures ANOVA). The x-axis represents the episode durations in minutes and the y-axis represents the percentage of episodes remaining in REM state for that episode length or longer. Mean values, SEM. The triangles above the curves denote significant differences between the genotypes (p < 0.05, post hoc Bonferroni test). c Time course of NREM EEG slow-wave activity (SWA, 0.5–4 Hz) in the frontal derivation after 6-h sleep deprivation (SD). SWA values are expressed as % of mean 24-h baseline value (genotype*bin interaction: F(4,48) = 5.045, p = 0.002, two-way repeated-measures ANOVA). Mean values, SEM. The values inside the panels are p-values for the differences in the decline rate from the 1st to the 2nd 1-h interval between the genotypes (Wilcoxon rank sum test)

