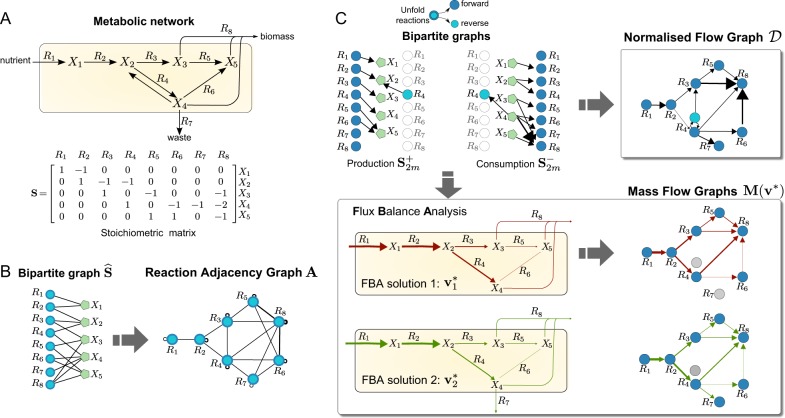
Fig. 1.
Graphs from metabolic networks. a Toy metabolic network describing nutrient uptake, biosynthesis of metabolic intermediates, secretion of waste products, and biomass production.32 The biomass reaction is R8: X3 + 2X4 + X5. b Bipartite graph associated with the boolean stoichiometric matrix , and the Reaction Adjacency Graph (RAG)16 with adjacency matrix . The undirected edges of A indicate the number of shared metabolites among reactions. c The Normalised Flow Graph (NFG) and two Mass Flow Graphs (MFG) constructed from the consumption and production stoichiometric matrices (5). Note that the reversible reaction R4 is unfolded into two nodes. The NFG in Eq. (8) is a directed graph with weights representing the probability that a metabolite chosen uniformly at random from the stoichiometric matrix is produced by source reaction is consumed by the target reaction. The MFGs in Eq. (12) are constructed from two different Flux Balance Analysis solutions ( and ) obtained by optimising a biomass objective function under different flux constraints representing different environmental or cellular contexts (see Sec. SI 2 in the Supplementary Information for details). The weighted edges of the MFGs represent mass flow from source to target reactions in units of metabolic flux. The computed FBA solutions translate into different connectivity in the resulting MFGs

