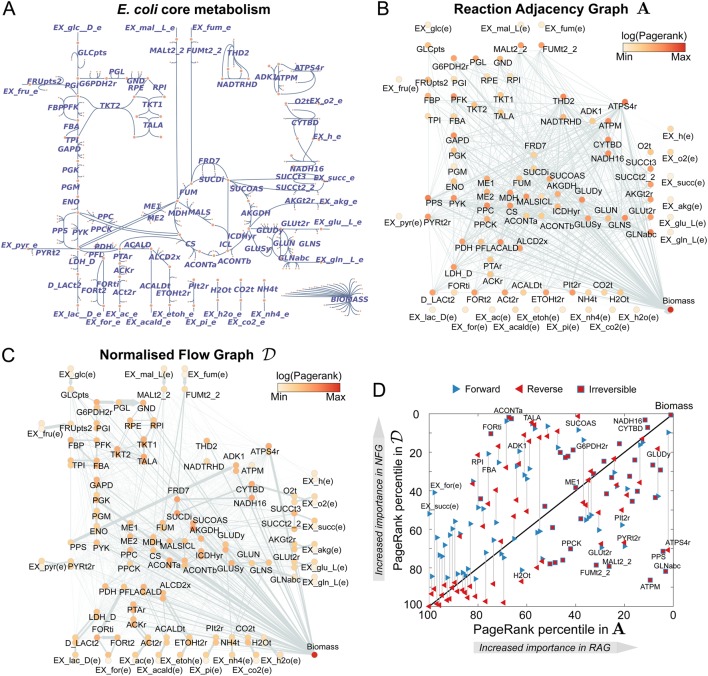
Fig. 2.
Graphs for the core metabolism of Escherichia coli. a Map of the E. coli core metabolic model created with the online tool Escher.33,54 b The standard Reaction Adjacency Graph A, as given by Eq. (3). The nodes represent reactions; two reactions are linked by an undirected edge if they share reactants or products. The nodes are coloured according to their PageRank score, a measure of their centrality (or importance) in the graph. c The directed Normalised Flow Graph , as computed from Eq. (8). The reversible reactions are unfolded into two overlapping nodes (one for the forward reaction, one for the backward). The directed links indicate flow of metabolites produced by the source node and consumed by the target node. The nodes are coloured according to their PageRank score. d Comparison of PageRank percentiles of reactions in A and . Reversible reactions are represented by two triangles connected by a line; both share the same PageRank in A, but each has its own PageRank in . Reactions that appear above (below) the diagonal have increased (decreased) PageRank in as compared to A

