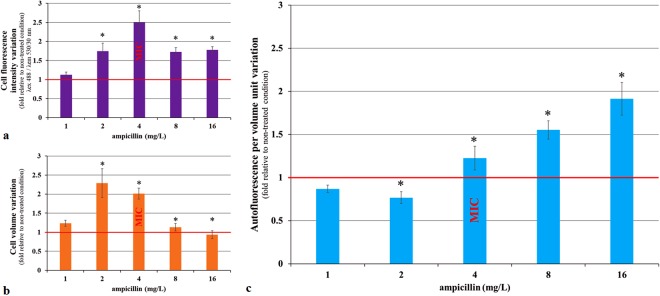
Figure 2.
Change in the autofluorescence, volume and autofluorescence per volume unit of E. coli cells after 2 hours of ampicillin treatment. E. coli 7705035 cells were treated, with a range of ampicillin concentrations during exponential growth. After 2 hours of treatment, images of 20,000 cells per condition were collected using the ImageStream flow cytometer system. (a) The cell autofluorescence intensity (λex 488 nm/λem 530/30 nm). (b) The cell volume. (c) The autofluorescence intensity per volume unit. For each cell, the fluorescence was normalized by the cell volume. Data are represented as a variation relative to a non-treated control. Each value represents the mean (+/−standard error) of the median values of four independent experiments. The asterisk represents significant differences in the ampicillin 1 versus ampicillin 0 (reference) condition according to 1-way ANOVA Dunn’s comparison test p value < 0.05.

