Figure 5.
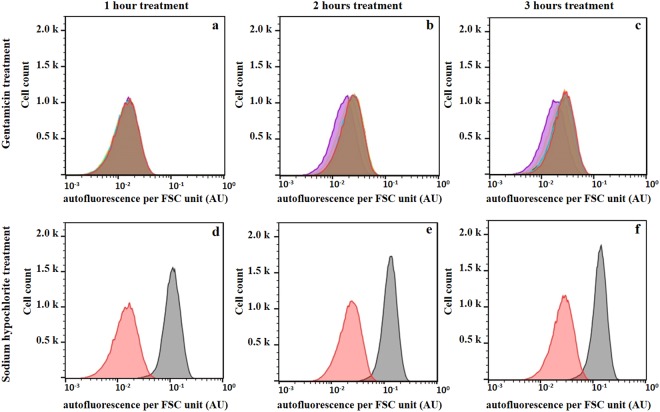
Effects of gentamicin and sodium hypochlorite treatment on the autofluorescence of E. coli cells. E. coli 7705035 cells were treated with a range of gentamicin concentrations corresponding to 0 (red), 0.125 (light blue), 0.25 (orange), 0.5 (MIC; light green), 1 (dark green), 2 (brown) and 4 mg/L (violet) or 0.08% sodium hypochlorite (grey) for 3 hours of the exponential growth. Autofluorescence and FSC of treated cells and untreated control were measured after 1, 2 and 3 hours of incubation using a flow cytometer. Cell autofluorescence was normalized by the FSC signal to obtain the autofluorescence per FSC unit. (a), (b) and (c) 1, 2 and 3 hours of gentamicin treatment respectively. The overlap of red, light blue, orange, light green and dark green produces the brown area. (d), (e) and (f) 1, 2 and 3 hours of sodium hypochlorite treatment respectively. This figure presents results of representative experiments, which were independently repeated 4 times.

