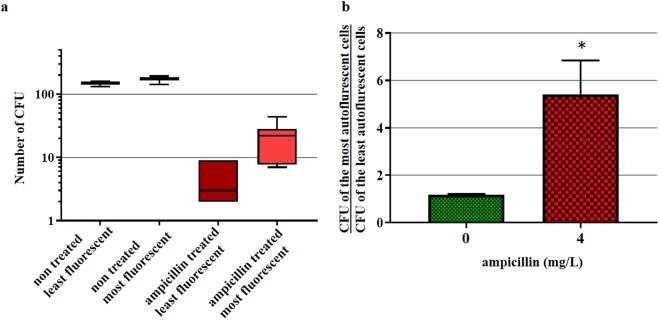
Figure 8.
Autofluorescence as a predictor of the survival of ampicillin-treated E. coli cells. E. coli 7705035 cells were incubated with 4 mg/L ampicillin (MIC). After 2 hours of incubation, the autofluorescence of treated and non-treated control cells was analyzed using the S3e cell sorter. 200 of the least and 200 of the most autofluorescent cells were sorted and plated on LB agar. After overnight growth, colony-forming units (CFU) were counted to assess the bacterial survival. (a) Box plot of the CFUs. (b) The mean ratio (+/−standard error) between the number of CFUs of the most and the least fluorescent cells of treated and non-treated control cells per experiment. Presented data are from six independent experiments. The asterisk represents significant difference according to paired T-test p value: 0.034.

