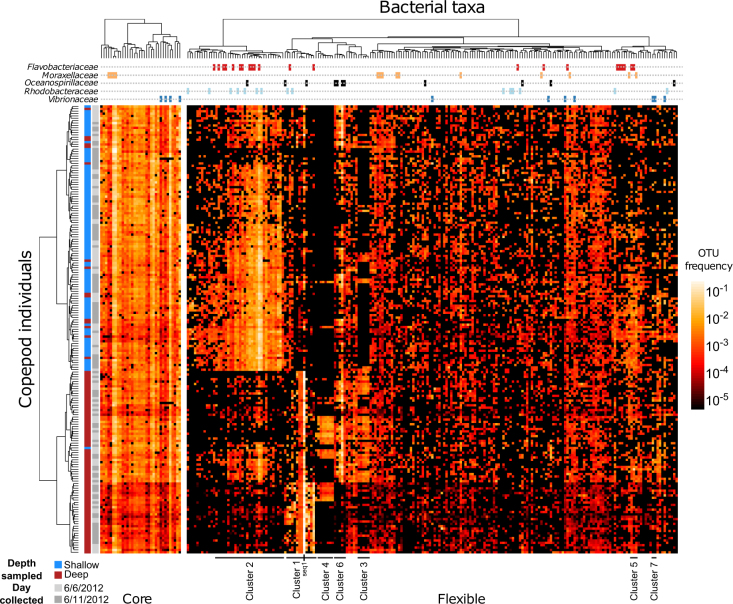
Fig. 2.
Physiologically diverse copepods share a common “core”, but many OTUs are patchily distributed across copepod individuals. Compositional heat map of a subset of OTUs (mean abundance >2 × 10⁻⁴) present over nearly 200 copepod individuals. The left heat map shows the “core” microbiome (OTUs present in >90% of copepod-associated communities). The right heat map shows OTUs that are patchily distributed across copepods (present on <90% of copepods). In both heat maps, OTUs are clustered by their correlation (distance metric: log-transformed Pearson correlation as estimated with SparCC; clustered with Ward’s minimum variance method). Copepods are clustered by the overall similarity of their communities across core and patchily distributed components (distance metric: Euclidean distance between log-transformed relative abundances; clustered with Ward’s minimum variance method). The leftmost color-coded column indicates the depth at which an individual copepod was collected (blue, shallow; red, deep). The second from left color-coded column indicates the date on which the sample was collected (light gray, 6/6/2012; dark gray, 6/11/2012). The topmost lines indicate which OTUs fall into one of the five most commonly observed taxonomic families. OTU clusters from Fig. 4 (e.g., “Cluster 1”) are indicated. One particular bacterial taxon, seq1, is also indicated

