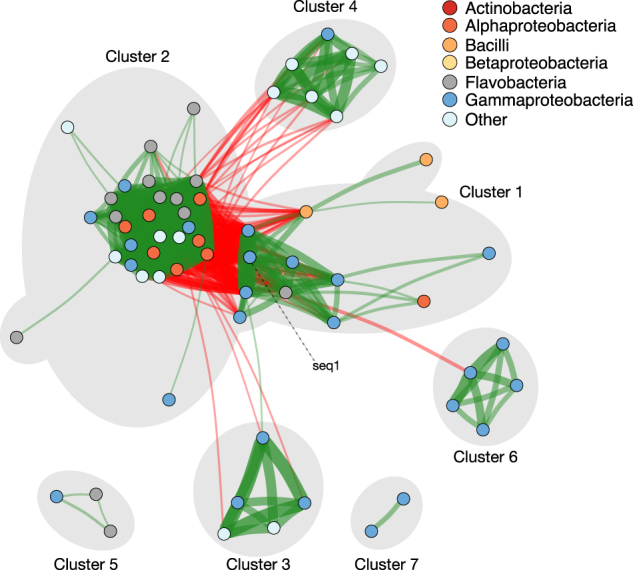
Fig. 4.

Across hundreds of copepod-associated communities, bacteria form a small number of highly positively correlated clusters. Nodes represent individual OTUs and are colored by taxonomy at the class level. Edges indicate positive (green) or negative (red) correlations between OTUs as approximated by SparCC. The magnitude of the correlation is proportional to the width of the edge. Nodes for which all inter-OTU correlations are negligible (|ρ| < 0.35) are not shown. Nodes are arranged according to a Fruchterman–Reingold force-directed graph drawing algorithm [47]. The positions of some nodes have been adjusted for disambiguation of cluster designations. Clusters of highly positively correlated OTUs are outlined in gray. One particular OTU, seq1, is indicated
