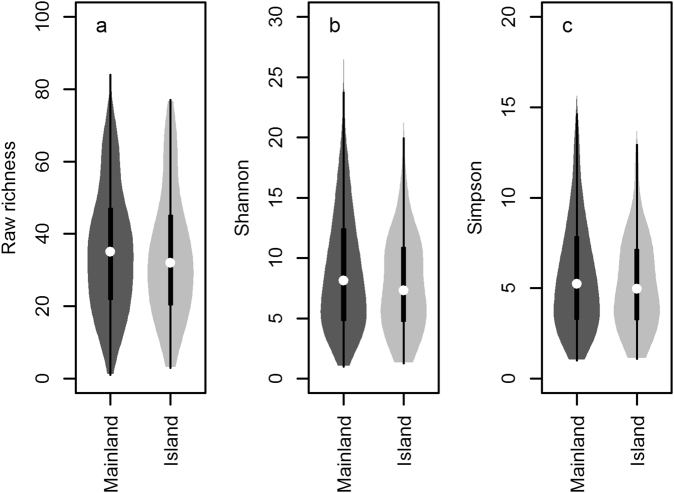
Fig. 3.
Estimates of diversity in island and mainland arbuscular mycorrhizal fungal communities. Three different diversity metrics are presented: a raw richness; and the asymptotic estimators for b exponential Shannon diversity; and c reciprocal Simpson diversity. The violin plots show the distribution of diversity values (filled curves); as well as the median value (white point), quartiles (black bar) and range (whiskers). Diversity was measured at the level of host plant species per plot (i.e., pooling up to 4 individual samples)

