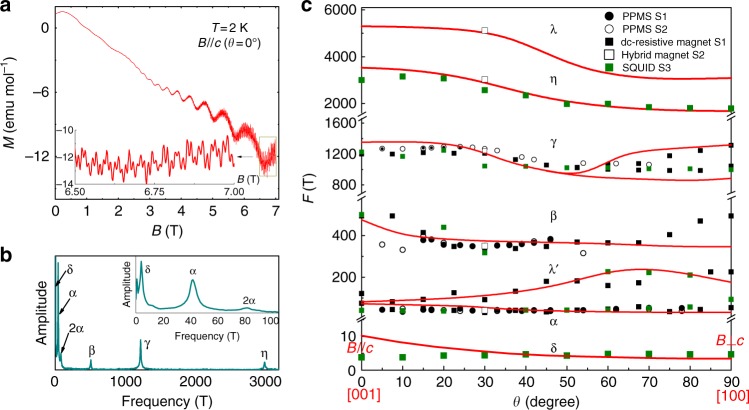
Fig. 4.
Magnetization oscillations and angle-dependent oscillation frequencies. a Magnetization curve measured at T = 2 K on sample S3 with magnetic field applied along the c-axis. b FFT spectra of dHvA oscillations. Inset: enlargement of FFT spectra. c Angle dependences of the frequencies extracted from the SdH and dHvA oscillations of different samples are labeled with different symbols. Theoretical calculated results are plotted with solid red lines

