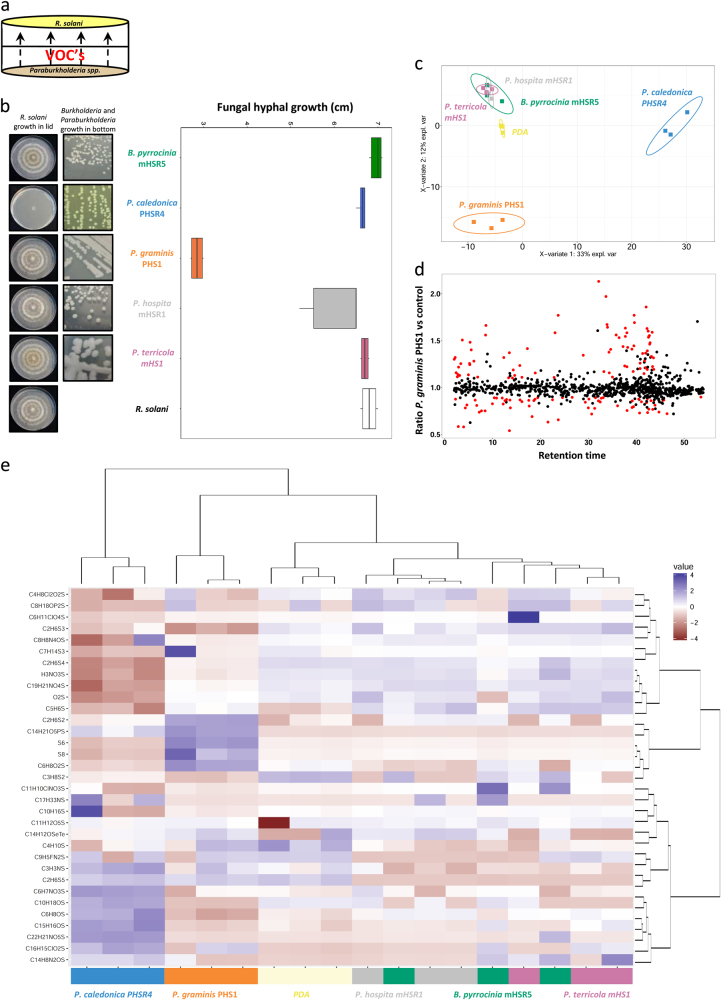
Fig. 3.
a Schematic representation of the sandwich assay to screen for VOCs-mediated antifungal activity. Left pictures represent the fungal growth after four days of VOCs exposure and right pictures depict the colony morphology of the selected Burkholderia and Paraburkholderia strains. b Box plot showing the inhibition of fungal growth after four days of exposure to bacterial VOCs. Radial growth of the fungus exposed to the VOCs was expressed relative to the hyphal growth in the control. Boxes represent the mean with standard errors of six independent biological replicates. Asterisks indicate a statistical difference from the control (exposed to medium only) (Student’s t-Test, P < 0.05). c PLS-DA 2D-plot of GC-MS data of VOCs emitted by the different bacterial species after four days of incubation. d. Ratio between VOCs emitted by P. graminis PHS1 and the control (B. pyrrocinia mHSR5, P. caledonica PHRS4, hospita mHSR1, terricola mHS1, and PDA without bacteria (control)). Red dots indicate VOCs differentially produced (at least 2.1× higher than the control) by P. graminis PHS1 (Kruskal and Wallis, Benjamini–Hochberg P < 0.1). e Hierarchical cluster and heatmap analyses of sulfurous VOCs produced by the selected strains. Columns represent three replicate VOC measurements of each of the five species and the medium alone (PDA as control). Rows represent the different sulfurous VOCs (red: low abundance; blue: high abundance); several of which were tentatively annotated

