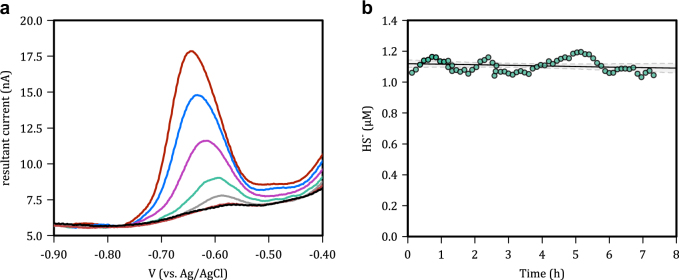
Fig. 2.
a Raw voltammetric scans demonstrating the sensitivity and robust nature of the sulfide signals generated in our experiments. Black trace = 0 nM, red trace (bottom) = 2.5 nM −1, gray trace = 30 nM , green trace = 60 nM , pink trace = 120 nM , blue trace = 210 nM , red trace (top) = 300 nM . Scan direction was from positive to negative. b Control experiment demonstrating the stability of sulfide in filtered seawater in the incubation vessel. Linear regression has a slope of -0.002 ± 0.004 µM h−1 and is thus not significantly different than zero demonstrating stability

