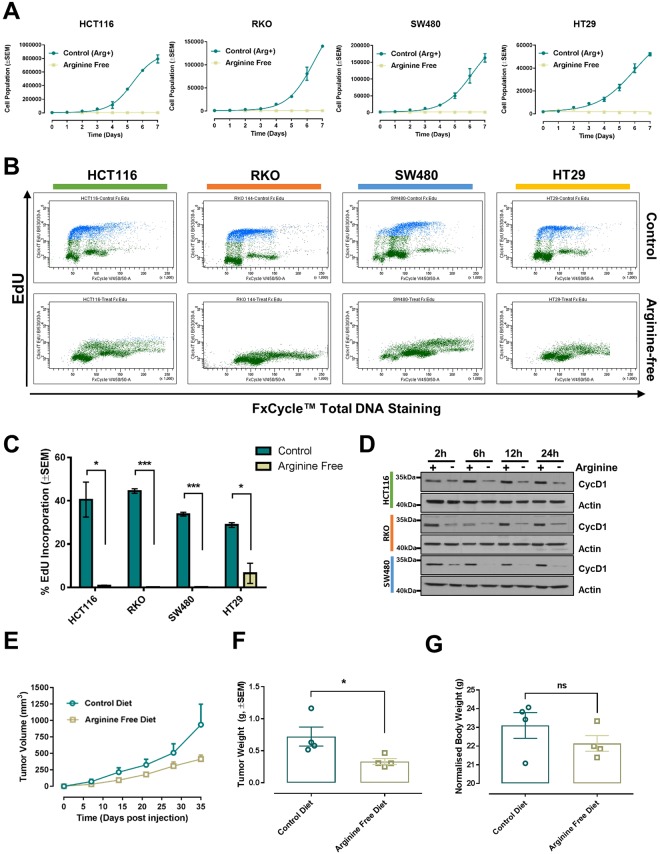
Figure 1.
Arginine auxotrophy in CRC. (A) Growth curves of the indicated cell lines with or without arginine supplementation. Data are presented as mean ± SEM of three independent experiments. (B) Representative flow cytometry scatterplots of EdU incorporation in HCT116, RKO, HT29 and SW480 CRC cell lines grown in control medium or arginine-free medium for 24 h. EdU was measured using the Click-iT® EdU Alexa Fluor® kit and total DNA stained using FxCycle™ Violet Stain. (C) Quantification of EdU incorporation from three independent experiments. Data are presented as mean ± SEM, two-tailed t-test. *P < 0.05, ***P < 0.001. (D) Western blot analysis of Cyclin D1 (CycD1) protein expression in HCT116, RKO and SW480 CRC cell lines following arginine deprivation for the indicated times. Actin was used as endogenous loading control. Original western blots are reported in Supplementary Fig. S15. (E) Graph showing the growth of xenografted HCT116 cells in immunocompromised mice fed a control diet or an arginine-free diet. Data are plotted as mean ± SEM and were analyzed using mixed linear regression analysis (P = 0.03; P < 0.05 indicates a statistically significant difference in tumor growth rate between control and treated animals over time). (F) Weight of excised tumor measured at endpoint. Data are plotted as mean ± SEM. *P < 0.05, two-tailed t-test (n = 4 animal per group). (G) Animal body weights at endpoint plotted as mean ± SEM. No statistical differences were detected between the two diet groups, two-tailed t-test (n = 4 animals per group).

