Fig. 2.

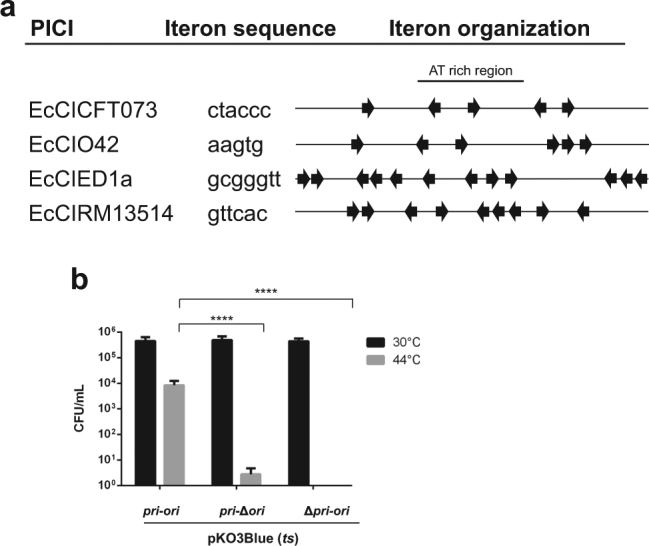
Characterization of GN PICI replication origins. a Comparative map of the replication origins of several E. coli PICIs. The iterons are represented by arrows, and their sequences are shown at left. Note that there are always two sets of iterons flanking an AT rich region, which could be the melting site. b Testing EcCICFT073 pri-rep-ori function. pK03Blue derivative plasmids pri-ori, pri-∆ori or ∆pri-ori were tested for maintenance in DH5α on selective agar at the permissive (30 °C) or restrictive (44 °C) temperature. A One-way ANOVA with Tukey’s multiple comparisons test was performed to compare mean differences within rows. Adjusted p values were as follows: pri-ori 44 °C vs pri-∆ori 44 °C < 0.0001****, pri-ori 44 °C vs ∆pri-ori 44 °C < 0.0001****
