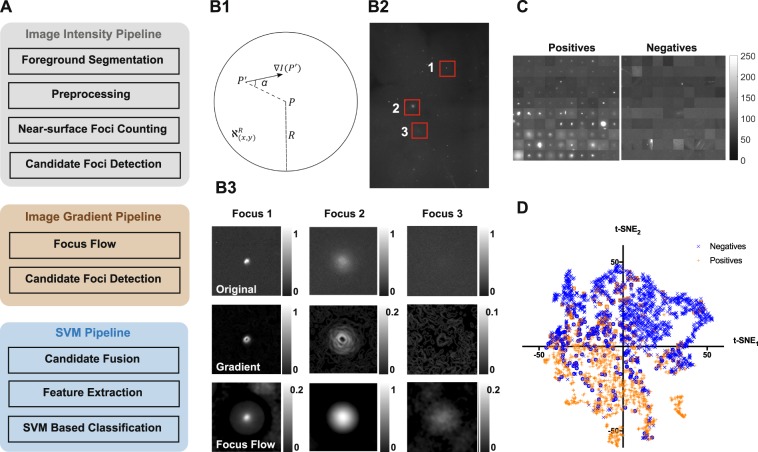
Figure 2.
(A) The flow chart of the foci counting algorithm, consisting of the image intensity branch, the image gradient branch, and the SVM branch. (B1) A graphical representation of the filter used in the focus-flow in a neighborhood . is the gradient vector at . (B2) Three foci at different depths on a tissue image. (B3) The three foci shown in ‘B2’ (top-row), their conventional gradients (middle row), and their Focus-flows. (C) A sample from the foci in the training dataset of 10 images. Each row contains a subset of training instances (positives and negatives) from each image. (D) The t-SNE plot of the training dataset applied to the SVM after training. (Incorrectly classified negatives are shown in blue circles and incorrectly classified positives are shown in orange squares).

