Figure 3.
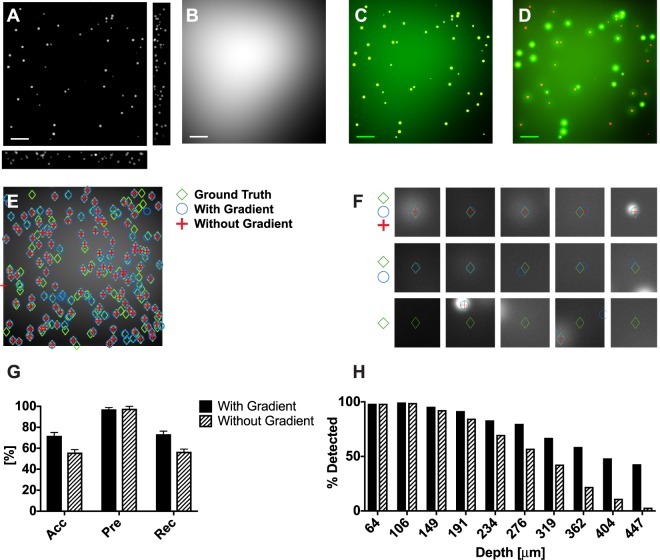
(A) Simulated thick tissue section with a random distribution of foci with a random number of cells in each focus. (B) Simulated heterogeneous auto-fluorescence background. (C) Simulated image of the tissue section in ‘A’ in the absence of scattering (green channel). Foci are shown in the red channel. Most of the foci are visible despite background. (D) Simulated image of the tissue section in ‘A’ in the presence of tissue scattering (green channel). Foci are shown in the red channel. Some foci are buried in the background (see the strong red). Scale bars are 1 mm. (E) Results of foci counting with (blue circles) and without (red crosses) gradient information. Shown in green diamonds are the ground truth foci locations. (F) Three subpopulations of foci. The top row shows foci detected with gradient information as well as without gradient information. The middle row shows foci detected with gradient information but weren’t detected without gradient information. Shown in the bottom row are foci that weren’t detected. (G) Accuracy, precision, and recall in foci detection with and without gradient information. (H) Percentage of foci detected with and without gradient information plotted against their depth. Including gradient information improved the foci detection at deeper locations.

