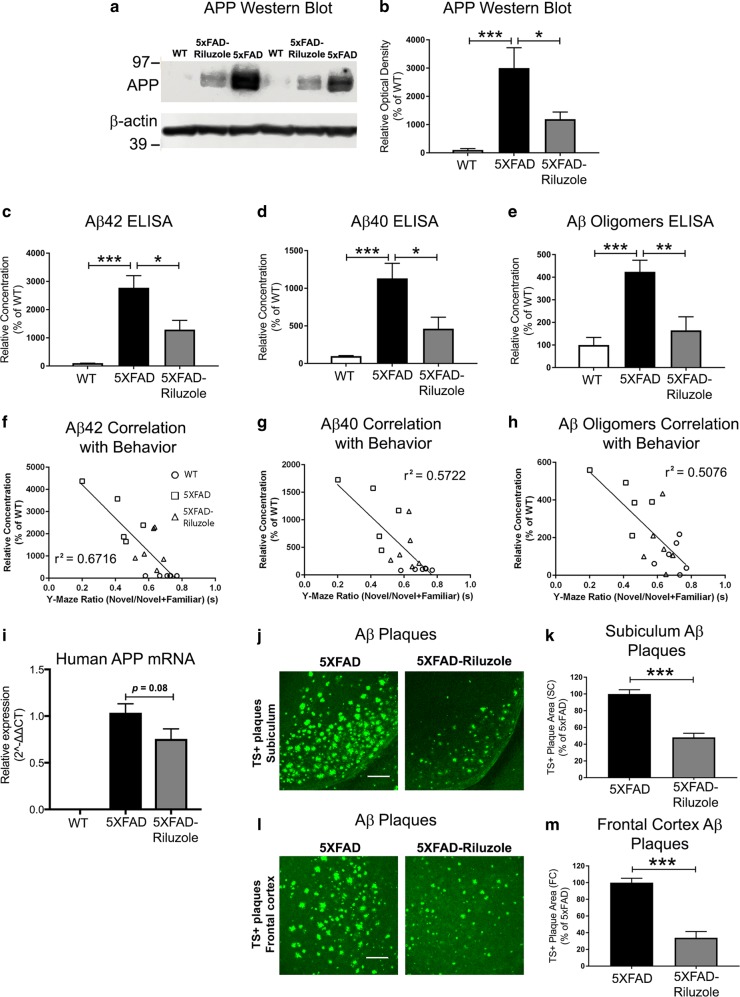
Fig. 2. Riluzole treatment reduces Aβ pathology which inversely correlates with memory performance in 5XFAD mice.
a Representative western blots of full-length APP protein expression are shown. The endogenous APP protein bands in WT mice appear faint because APP transgenic mice have significant overexpression, which required a short exposure time to obtain bands suitable for quantification of 5XFAD lanes. b Quantification data showing that APP protein expression was significantly different among groups (F(2,15) = 11.04, p = 0.0011): between wild type and 5XFAD (p = 0.0009) and between 5XFAD and 5XFAD-Riluzole mice (p = 0.0279). c Soluble Aβ42 was significantly different among groups (F(2,15) = 18.60, p < 0.0001): between wild type and 5XFAD (p < 0.001) and between 5XFAD and 5XFAD-Riluzole mice (p = 0.0108). d Soluble Aβ40 was significantly different among groups (F(2,15) = 12.90, p = 0.0005): between wild type and 5XFAD (p = 0.0004) and between 5XFAD and 5XFAD-Riluzole mice (p = 0.0141). e Aβ oligomers were significantly different among groups (F(2,15) = 12.00, p = 0.0008): between wild type and 5XFAD (p = 0.0009) and between 5XFAD and 5XFAD-Riluzole mice (p = 0.0057). f Aβ42 peptide (r2 = 0.6716, p < 0.0001), g Aβ40 peptide (r2 = 0.5722, p = 0.0004), and h Aβ oligomers (r2 = 0.5076, p = 0.0013) each showed a significant correlation between Aβ levels and memory performance in Y-maze. i The qRT-PCR analysis revealed no expression of human APP in WT mice, and no statistically significant difference between 5XFAD and 5XFAD-Riluzole (p = 0.08). j, k Riluzole treatment significantly reduced TS+ Aβ plaque area in the subiculum region of the hippocampus in 5XFAD mice (p < 0.001). l, m The Aβ plaque load in the frontal cortex was also significantly reduced by riluzole in 5XFAD mice (p < 0.001). The data in panels (b–e, l, k, m) is shown as mean ± S.E.M. The western blot data in panels (a, b) and ELISA data in panels (c–e) is based on WT, n = 6, 5XFAD, n = 6, and 5XFAD-Riluzole, n = 6. The correlation data in panels (f–h) is based on WT, n = 6, 5XFAD, n = 5, and 5XFAD, n = 6. The qRT-PCR data in panel (l) is based on WT, n = 10, 5XFAD, n = 7, 5XFAD-Riluzole, n = 8. The TS+ Aβ plaque load data in panels (j–m) is based on 5XFAD, n = 5, and 5XFAD-Riluzole, n = 5. *p < 0.05, **p < 0.01, ***p < 0.001. Scale bar = 100 µm

