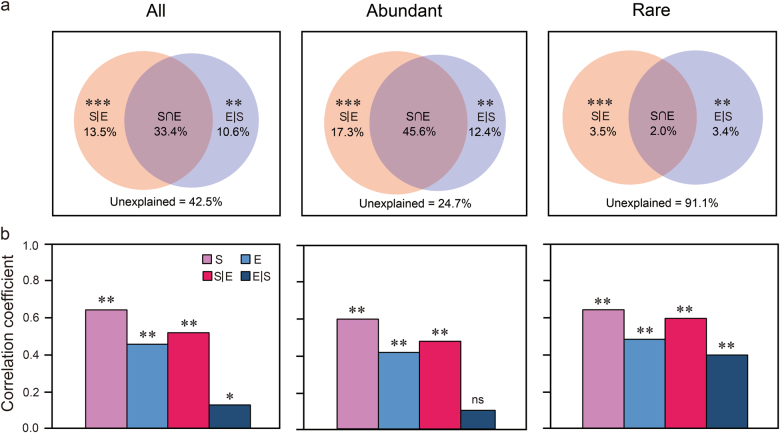
Fig. 4.
The variation in bacterioplankton metacommunity explained by spatial and environmental variables, respectively. a Variation partitioning analysis of the bacterioplankton community composition between spatial and environmental variables. The variation explained by pure spatial and environmental factors corresponds to the bacterial community without the effect of the other by ANOVA permutation tests. **P < 0.01 and ***P < 0.001. b Mantel and partial Mantel tests for the correlation between community dissimilarity and environmental and spatial factors using Pearson’s coefficient. *P < 0.05, **P < 0.01. ns not significant, S|E pure spatial variation, E|S pure environmental variation, S ∩ E share explained variation, 1 - S|E - E|S - S ∩ E unexplained variation

