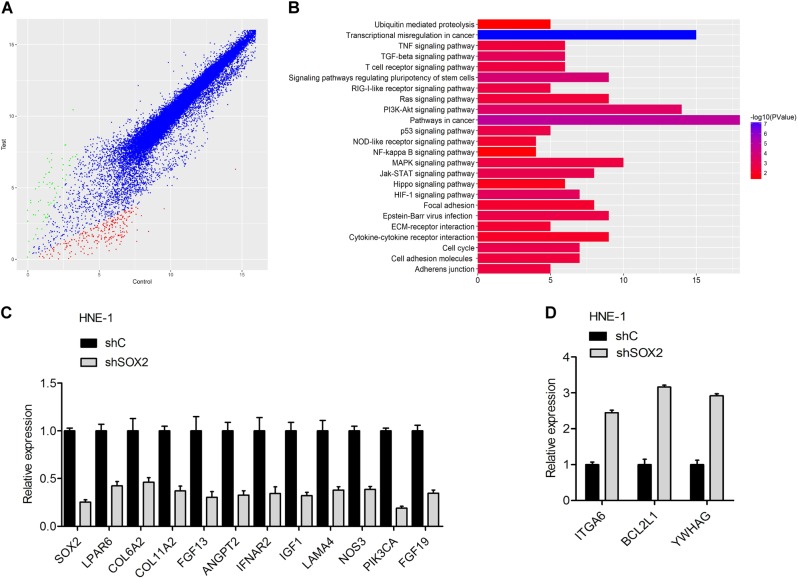
Fig. 3. Identification of SOX2 downstream candidate genes in nasopharyngeal carcinoma.
a Scatter plot of 23230 gene expression levels (log2) in HNE-1 cells transfected with SOX2 shRNA (y-axis) compared with the control group (x-axis). Green dots, set of genes exhibiting significant upregulation upon SOX2 knockdown; red dots, set of genes exhibiting significant down-regulation upon SOX2 knockdown; black dots, the genes without significant change. b The signaling pathways response upon SOX2 knockdown by Gene KEGG analyses. c, d mRNA expression of eleven down-regulation genes (c) and three upregulation genes (d) was confirmed by real-time PCR analysis. Error bars ± SD. Data are representative from two independent experiments

