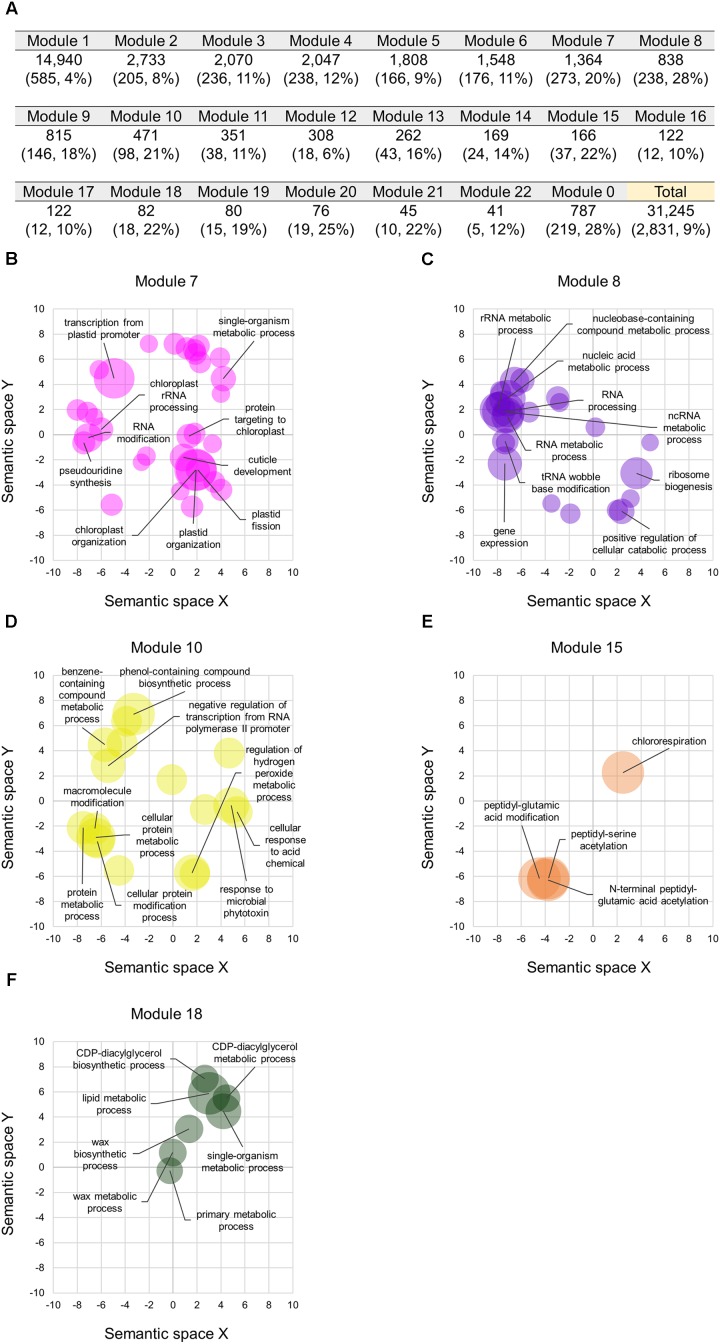
FIGURE 4.
Co-expression modules containing the differentiated homoeologs in hexaploid wheat. (A) Number of homoeologs and differentiated homoeologs (numbers with their percentage in brackets) in each of the co-expression modules. The Module 0 represents genes that are not clustered in a co-expression module. Percentages represent proportions of the differentiated homoeologs in each of the co-expression modules. (B–E) Enriched GO terms in the biological processes of genes in the co-expression module 7 (B), 8 (C), 10 (D), 15 (E), and 18 (F) projected to a 2D semantic space. Circle size represents the –log10 of FDR values calculated using REVIGO analysis. The top ten enriched GO terms are labeled in the plots.

