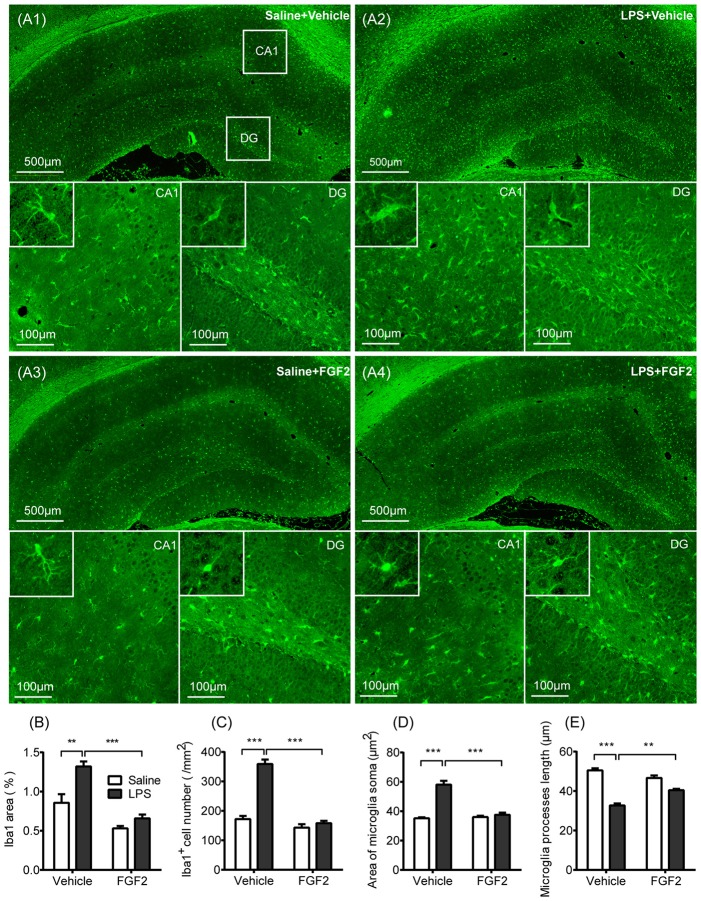
Figure 2.
FGF2 decreased microglia activation in hippocampus induced by central LPS treatment. (A1–A4) Representative photographs of the ionized calcium-binding adaptor molecule-1 (Iba1) expression in hippocampus. In LPS + Vehicle group, there were increased expression of microglia identification marker Iba1 and more Iba1 positive cells in CA1 and DG with the swollen soma and retracted processes. In LPS + FGF2 group, the number and morphology of Iba1 positive cells were closer to the control group. (B) The comparison of the percentage of Iba1 positive area. The increased Iba1 area was reversed by FGF2 in LPS-treated rats. (C) The comparison of the density of Iba1 positive cells. The increased Iba1 cell density was reversed by FGF2 in LPS-treated rats. (D) The comparison of the microglial soma area. The increased soma area was reversed by FGF2 in LPS-treated rats. (E) The comparison of microglia processes length. The decreased processes length was reversed by FGF2 in LPS-treated rats. Two-way ANOVA with Tukey’s multiple comparisons test, n = 4 per group. Data are presented as the means ± SEM. **p < 0.01, ***p < 0.001. LPS, lipopolysaccharide; FGF2, fibroblast growth factor 2; DG, dentate gyrus.

