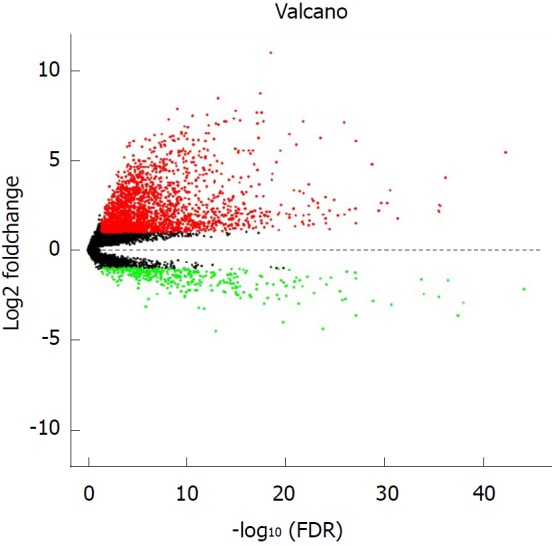
Figure 1.

Volcano plot of the differentially expressed long non-coding RNAs between hepatocellular carcinoma tumor specimens and peritumoral liver specimens. The X-axis represents the adjusted FDR, and the Y-axis represents the value of the log2 fold change. Aberrantly expressed long non-coding RNAs (lncRNAs) were calculated using the EdgeR package. Red dots represent upregulated lncRNAs in the hepatocellular carcinoma (HCC) tumor specimens, while green dots indicate downregulated lncRNAs compared with the peritumoral liver specimens. Black dots show the lncRNAs without significant differences between the HCC tumor and peritumoral liver specimens. Altogether, 2240 upregulated and 353 downregulated lncRNAs were found. This volcano plot was conducted using the ggplot2 package of R language.
