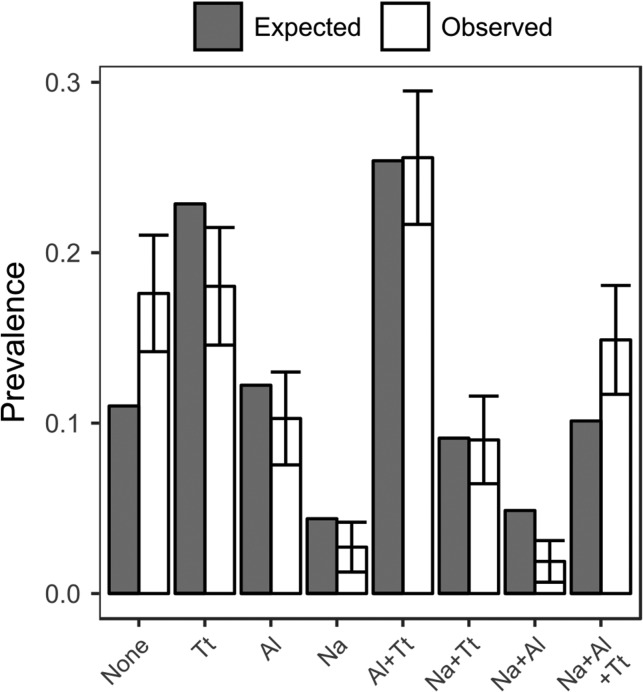
Figure 1.
Observed and expected prevalences of single infections and co-infections. Observed values were calculated as the number of cases in an infection type group divided by the total number of participants. Expected values were calculated using three-way contingency tables. Bars on observed values are 95% confidence intervals. Na: N. americanus; Al: A. lumbricoides; Tt: T. trichiura.

