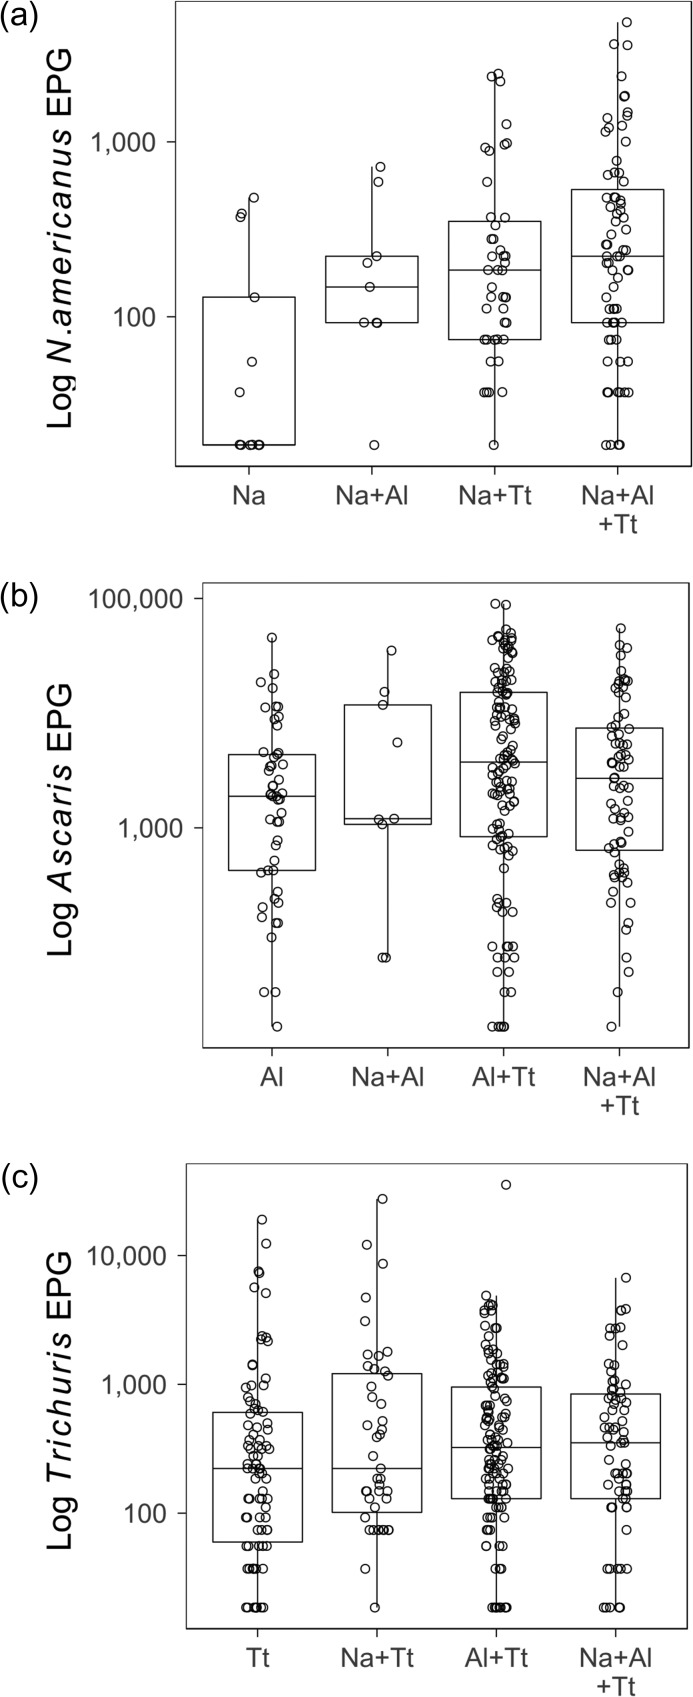
Figure 2.
Egg deposition distributions by infection type group. Egg deposition was measured as EPG. Medians, interquartile ranges and individual data points are plotted on a log scale. (a) The egg deposition from N. americanus infections, including single infections, infections with Ascaris or Trichuris and triple infections. (b) The egg deposition from Ascaris infections. (c) The egg deposition from Trichuris depositions. Na: N. americanus; Al: A. lumbricoides; Tt: T. trichiura.

